Mapping the Medieval Townscape: a digital atlas of the new towns of Edward I
Keith Lilley, Chris Lloyd, Steve Trick, 2005.
https://doi.org/10.5284/1000022. How to cite using this DOI
Digital Object Identifiers
Digital Object Identifiers (DOIs) are persistent identifiers which can be used to consistently and accurately reference digital objects and/or content. The DOIs provide a way for the ADS resources to be cited in a similar fashion to traditional scholarly materials. More information on DOIs at the ADS can be found on our help page.
Citing this DOI
The updated Crossref DOI Display guidelines recommend that DOIs should be displayed in the following format:
https://doi.org/10.5284/1000022
Sample Citation for this DOI
Keith Lilley, Chris Lloyd, Steve Trick (2005) Mapping the Medieval Townscape: a digital atlas of the new towns of Edward I [data-set]. York: Archaeology Data Service [distributor] https://doi.org/10.5284/1000022
Data copyright © Dr Keith Lilley, Chris Lloyd, Steve Trick unless otherwise stated
This work is licensed under the ADS Terms of Use and Access.
Primary contact
Dr
Keith
Lilley
School of Geography
Queen's University Belfast
University Road
Belfast
BT7 1NN
Northern Ireland
Tel: 0208 902 73363
Fax: 0208 903 21280
Resource identifiers
- ADS Collection: 433
- DOI:https://doi.org/10.5284/1000022
- How to cite using this DOI
Digital Object Identifiers
Digital Object Identifiers (DOIs) are persistent identifiers which can be used to consistently and accurately reference digital objects and/or content. The DOIs provide a way for the ADS resources to be cited in a similar fashion to traditional scholarly materials. More information on DOIs at the ADS can be found on our help page.
Citing this DOI
The updated Crossref DOI Display guidelines recommend that DOIs should be displayed in the following format:
https://doi.org/10.5284/1000022
Sample Citation for this DOI
Keith Lilley, Chris Lloyd, Steve Trick (2005) Mapping the Medieval Townscape: a digital atlas of the new towns of Edward I [data-set]. York: Archaeology Data Service [distributor] https://doi.org/10.5284/1000022
The Atlas
WINCHELSEA, Sussex | |
| NGR: | TQ905175 |
| Type: | Market town with partial earthen defences and stone gate-houses |
| Date of Borough Charter: | ancient borough, privileges transferred to new site, plots formally taken up in July 1288 |
| Number of Plots: | 802 in 1292 |
| Number of Property Holders: | 690 persons in 1292 |
| Area of town (c.1300): | 151 acres/611,500m2 (approx.) |
| Overall dimensions of town (c.1300): | 4000 feet (Rectory Lane)/1800 feet ('fifth street') (1219m/550m) |
Interactive Map:
ArcIMS is slowly being abandoned by ESRI, so maintenance of the ArcIMS maps is becoming extremely difficult. We have decided to migrate this map interface to a more sustainable software stack using non-proprietary software. We will begin the migration to GeoServer and OpenLayers as soon as possible, but until then we apologise for any inconvenience.
Help for using the Interactive Map
An Interactive Map has been provided to enable you to examine the various spatial data compiled throughout the survey using basic WebGIS tools. To begin using the map click the button labelled 'Switch On' found in the box above.
Groups/Layers:
Each map contains several layers grouped under the following headings:
- Archaeology
- Plan Elements
- Metrics
- Survey Data
- Base Map
Layers can be selected either singularly or as a group. Toggling the group visibility icon ![]() will display/hide every layer featured within the specific group. To display a single layer within a group, the group must be opened and the relevant layer can then be enabled/disabled by selecting the layer visibility icon
will display/hide every layer featured within the specific group. To display a single layer within a group, the group must be opened and the relevant layer can then be enabled/disabled by selecting the layer visibility icon ![]() . However, only one Base Map layer can be displayed at any one time.
. However, only one Base Map layer can be displayed at any one time.
A layer can be made active be either clicking the relevant radio button or by clicking the layer title. The layer will become highlighted when it is active.
The Group/Layer panel can be hidden by clicking on the vertical grey button marked with an arrow. The arrow button will slide toward the left of the map area and the map will be re-rendered filling the whole area. Clicking the arrow button again will show the Layer/Group panel. When the Layer/Group panel is hidden/shown the active tool will be deselected.
[top]
Tools:
The various tools found in the tool panel on the right of the map allow a further element of interactivity. There is a handy text tip next to each button on the interface to explain what each button is for, but on this page we go into a little bit more detail:
 | Zoom in - Click on the map to zoom in (the map will be centred on your mouse click). |
 | Zoom out - Click on the map to zoom out (the map will be centred on your mouse click). |
 | Zoom to full extent - Zoom to the extent of all the layers within the map - this is a quick way of getting back to the map's starting position |
 | Pan - Click on the map and drag it in any direction to change the area of view. |
 | Identify - Click on a feature on the active layer to see the data attached to it. The data will appear in a popup window. |
 | Rectangle select - Use your mouse to draw a rectangle on the screen to select a group of features within the active layer. The associated data from these features will be displayed in a popup window and the selected features will be highlighted. |
 | Clear selection - If you have any features selected/highlighted, this tool will unselect them. |
 | Show legend - Show a map legend of archaeological features in a popup window. Point data and basemap information is omitted. |
The tool in use will be highlighted by a red box.
[top]
General guidance:
Be patient! Every time you zoom, pan, refresh or query the map, a request is sent to the server and new image is created and delivered to your desktop. Whilst this request is being sent, do not try and send extra requests as this will produce error messages. Your browser can only send and receive one GIS request at a time so don't push it!
[top]
The GIS files are also available as downloads if further functionality is required.
Discussion:
The following sections are also available to download in PDF format.
Early history of the town
Winchelsea, Maurice Beresford notes, 'has deservedly received much attention from students of medieval town planning'.[405] The reason for this attention is to do with the very detailed records (for the time) that survive of the town's foundation, and also the well-preserved physical remains of its grid-plan layout occupying a hill-top in this pretty corner of east Sussex.[406] Its origin is different, too, from the Edwardian new towns of north Wales. Rather then being the outcome of Edward's warring with the Welsh, New Winchelsea's origins lie in the demands voiced by inhabitants of Old Winchelsea, whose long-established port was being threatened by flooding from the sea.[407] This relocation of the town required royal intervention and approval, and hence it is well-documented by Edward's bureaucrats.
The first sign that Winchelsea's inhabitants were concerned about the threat of flooding comes in the reign of Edward's father, during the mid-thirteenth century. In 1249 they were instructed to be 'diligent in repairing and preserving the town against the sea', but in the following year a storm 'overwhelmed more than 300 houses and certain churches', and then yet another, in 1252, recorded by Matthew Paris: 'at Winchelsea, a port most valuable to the English and especially to Londoners, the sea, bursting through the sea walls, invaded mills and houses and swept away many drowned men'.[408] Subsequently, in the 1270s, further difficulties were experienced. In autumn 1271 the quay and 'a great part' of the church of St Thomas were 'washed away by the floods and tempests of the sea', and a call made for the 'speedy provision... for the repair of the said quay'.[409] Five years later, in 1276, Matthew de Horne - one of Winchelsea's more senior 'barons' - was granted a plot of land measuring 100 by 50 feet 'so that the said Matthew may make a quay upon the said place for the defence of his house against inundation of the sea and build upon it'.[410] The townspeople were losing the battle and their sense of urgency is clear. Not only that, the revenues accruing from the town were falling, too, as Maurice Beresford points out, with a drop from around £80 in the 1260s to about half this in 1278.[411] It was in this context that provision for a new town of Winchelsea was being made. This began in autumn 1280. With 'the old town being for the most part submerged by the sea', the king's steward, Ralph de Sandwich, was given a commission 'to extend or buy or obtain certain lands... which are suitable for the new town of Winchelsea'.[412] The town was 'to be built upon a hill called Yhamme [Iham]', a higher, drier site where the threat of coastal flooding was out of the question.[413] The process by which New Winchelsea was set out upon this hill is revealed by a remarkably detailed sequence of records.
New Winchelsea was established by a process of negotiation, between the king's agents, the 'barons' (burgesses) of Old Winchelsea, and the holders of lands earmarked for the new town. This all took place between November 1280 and June 1288, a period of nearly eight years. The protracted nature of creating the new town is of note. Presumably it was made complicated by settling local landholding agreements and dealing with the needs of the barons. It contrasts sharply with the new towns established in north Wales, which were by and large up and running within a year or two at the most. The 'certain lands' that Sandwich was negotiating over in November 1280 included arable, coppice, buildings, gardens and courtyards in the manor of Iham which had belonged to John Tregoz, and which he had then passed to his daughter and her husband, William de Grandison, prior to the Crown acquiring them in 1284.[414] There were also buildings and lands belonging to others, including the Abbot of Battle and the abbey of Fécamp in Normandy which held the church of St Leonard as well as the 'little town of Iham' which already existed on the hill-top.[415] All these landholdings demanded careful negotiation before the new town could be set out on the site, a process that lasted into the following year.
A year after Ralph de Sandwich's commission, and presumably in response to his findings, a further stage in negotiations took place. This was initiated in November 1281 when Stephen de Penecestre, Iter d'Angouleme and Henry le Waleys were appointed by the king 'to assess certain places at Ihamme, and to let them to the barons and goodmen of Winchelsea for building; saving to the immediate lords of the aforesaid plots a reasonable extent of every acre'.[416] Here we see these three agents at work assessing the land where the new town was to be set out, and thinking about how it should be transferred. The three men involved in this were all experienced administrators of urban affairs. Penecestre was warden of the Cinque Ports at the time (of which Winchelsea was one), while Angouleme audited Irish Exchange accounts in 1283, and had become constable of Bordeaux in 1289-90.[417] Le Waleys, originally from Striguil near Chepstow in the Welsh borders, was himself twice mayor of London (1273-74, 1281-84) and had served as mayor of Bordeaux in 1275.[418] The process was not finished however. Two years later again, in March 1283, two of these three - Stephen de Penecestre and Henry le Waleys - were joined by John de Cobeham, 'a baron of the exchequer'.[419] They were instructed 'to assess certain places at Ihamme and to commit the same, at a certain rent according to their lawful extent, to the barons and goodmen of Winchelsea for building and dwelling purposes, saving to the immediate lords a reasonable extent of every acre'.[420] Here we seem to have decisions being made again about how much land was required and what its value would be, similar to the letter patent of 1281. Indeed, the shared phrasing of the two letters is striking. Does this suggest some delay had occurred in the process? Perhaps caused by protracted negotiations with landholders and townsfolk? If so, it seems by the autumn the situation was such that it was possible to lay the town out on the chosen site. Meanwhile, the old town was losing yet more revenue so that by 1283 it was just over £26, no doubt adding to the need to get on.[421]
The instruction issued by the king in October 1283 is one of the most explicit contemporary accounts we have in England for the formation of a new town, and it is often cited.[422] It records the 'appointment of Stephen de Penecestre, Henry le Waleys and Gregory de Rokesle to plan and assess the new town of Yhamme which the king is ordering to be built there for the barons of the town and port of Winchelsea', and for them 'to plan and give directions for streets and lanes (vicis et venelis) necessary for the said new town, for places suitable for a market, and for two churches, one to St Thomas, and the other to St Giles, as there are in the aforesaid town of Winchelsea, to assign and deliver to the said barons competent places according to the requirements of their state, and to provide and give directions concerning harbours and all other things necessary for the town', with a 'grant to the same barons that they be as free in the new town as in the old town of Winchelsea, and have the same free customs according to their charters'.[423] Once again, Penecestre and Waleys are joined by a new man, this time Gregory de Rokesley. Like Waleys, he had been mayor of London - in 1274-81 - and had connections with Gascony through his mercantile activities.[424] He was born in Kent and died in 1291, so he not only had local connections and knowledge (like Penecestre) but was also quite aged by the time he was appointed by the king to work at Winchelsea.[425] What they were doing is seemingly clear: 'to plan and give directions' for the town's streets, markets and churches, as well as plots for the barons to take up. It would appear that these three men were responsible for arranging the layout of new Winchelsea. Given their backgrounds though, as weighty merchants and civic dignitaries, are we to imagine that they had both the expertise and experience needed to devise the design for the town, and to lay it out on the ground? Or is it more likely that they were there simply overseeing such matters, instructing others on-site who had more technical knowledge and practical experience than they?
It seems that the efforts that were being made in 1283 to have New Winchelsea established did not fulfill all the requirements for the new town. Three years later on, in February 1286, a mandate was issued to Stephen de Penecestre: 'to lay out lots at fixed rents for dwelling purposes [at] a place called 'le Kenel' for the enlargement of the new town of Winchelsea'.[426] Compared to the letter issued in 1283 this is actually a much more explicit statement about Penecestre's tangible role in physically laying out the town - 'to lay out lots'. Together with his occurrence in all three previous instructions concerning New Winchelsea, issued since November 1281, he was the more influential character in the whole process at the local level. Whereas Angouleme, Cobeham, and Rokesley had come and gone, Penecestre had stayed the course, no doubt because of his position as warden of the Cinque Ports during this time. Of course, Waleys, too, had been an enduring presence between 1281 and 1283, but by 1286 we see Penecestre working alone to enlarge the town. This expansion of the town that he was undertaking at 'le kenel' probably lay towards the south.[427] It is also of note that in the same mandate he was asked to make 'a return for registration in the Exchequer of the names of all the inhabitants, their tenures and rents'.[428] This shows that by around this time the move by inhabitants to the new town was underway, a move no doubt hastened when 'the great storm of February 1288 completed the ruin of Old Winchelsea'.[429] The document that Penecestre drew up presumably formed the basis of the rent-roll which 'was drawn up by the mayor and 24 jurats of the town' in 1292 (and which William Homan used as a basis to reconstruct a map of how the town looked at this time).[430] It recorded 'the area of each plot and the annual rent due for it to the Crown, as well as the name of the person to whom it was allotted'.[431] It seems, then, that in the founding of new Winchelsea Stephen de Penecestre's role was a strong and important one.
The new town thus appears to have been established in a series of distinct stages according to the documentary accounts. It started with negotiations over land and property, then proceeded to selecting particular sites within the area of the hill, then laying out the town on the ground - its streets and plots, and spaces for churches and markets - and then, lastly, a survey of the properties within the town. All this took nearly eight years. It was only in 1288 that the new town appears to have finally replaced the old. In June of that year the sheriff of Sussex was informed that 'the king has granted to the barons of Winchelsea, by reason of the wreck that lately came to their town by the tempests of the sea, his site and plot of land of Ihamme... except 10 acres of land that the king retains for his own use, to dwell thereon and make their town of Winchelsea, and to hold at fee farm, so they shall be there as free as they were previously at Winchelsea and shall use and enjoy there the same liberties as they were wont to do at Winchelsea by the charters of the king's progenitors'.[432] With this the king made it clear that the new had replaced the old, but that the privileges the inhabitants previously had still remained. In July, John Kirkby, treasurer and 'a driving force behind major improvements in financial administration' in the royal exchequer, was appointed by the king to deliver the land of the new town to the barons of Winchelsea, and 'to appoint on behalf of the king a mayor and twenty-four jurats to make the final arrangements for the allocation and transfer of ground to the citizens of the new town'.[433] This act was recorded in the 1292 rental by the town's mayor and jurats, preserving for the urban community not only a list of the various properties that made up the new town but also its legal basis.[434] The rental also records the size and population of the town in 1292: comprising 802 plots held by 690 persons it was the largest of all the new towns founded in Edward's time.[435]
By 1288, then, all seems to have been done. Some issues remained, however. In 1303 William de Eschingham and William de Hastynges were appointed by the king to look into a complaint made by William Burgeys and John de Langhurst regarding 'compensation that has never been made for 35 acres of land within the site of the new town'.[436] They held the land prior to the town's development, and John Kirkby was meant to have provided them with 'a reasonable exchange'. Subsequently, the king 'appointed Stephen de Penecestre, John de Cobeham and Gregory de Rokesle to make such exchange... including compensation for any loss occasioned thereby, but by reason of the deaths of the bishop and the said commissioners it was not done'.[437] These were the three individuals working in the town in 1283. It had taken another twenty years for Burgeys and Langhurst to have their complaint heard, during which time their lands had become the new town. What happened to New Winchelsea after its foundation has been recounted elsewhere.[438] Suffice to say that the new town was initially provided with stone-built gates at each of its four main points of entry, was well-endowed with churches and religious institutions, including two friaries and three hospitals, and had a harbour on the river Brede.[439] There is some uncertainty over whether the town was encircled by earthwork and palisade defences linking with the four gates, though the line of a ditch on the west side of the town is possibly one such alignment.[440] Decline soon set in. After the fourteenth-century, and in the face of French attacks, a new set of defences created on a tighter circuit, cutting off the gradually-emptying southern part of the town where rents declined markedly in the 1340s and 1360s.[441] In due course - and with some irony considering the town's move to higher ground - the sea retreated leaving it stranded. Without a seaport the prosperity of this once important member of the Cinque Ports waned.
[top]
Design and plan of the town
The highly ordered gridded layout of Winchelsea is considered to be a prime example of medieval town planning. Thomas Tout regarded it as 'the most elaborate scheme of town planning ever devised even by Edward I'.[442] Yet it is easy to overlook the details of the plan of the town, which are themselves telling about the ideas of those who created it, and whose activities are glimpsed through the documentary records examined above. To do so really questions how far Edward himself was involved in the proceedings.
The layout of New Winchelsea has attracted a level of unsurpassed attention by historians of English medieval town-planning. In the main this interest is due to the survival of the town's detailed documentation, in particular the rental drawn up in 1292, just three or four years after the town's foundation.[443] This document captures in written form a contemporary picture of New Winchelsea's make-up and provided William Homan the opportunity to reconstruct a map of the town showing its probable layout in 1292.[444] Using as a basis the first edition Ordnance Survey plan he not only calculated the areas of the town's plots and street blocks ('chequers' or 'quarters') but also managed to work out how they were arranged as individual units of property. He was able to do this because the rental is a sequential list of individual properties, complete with their respective area (recorded in virgae - a medieval unit of area), and also their location within the town. The rental is arranged according to numbered quarters and streets, and the outlines of these survive in the town on the ground as street blocks, making the arrangements of plots and streets of 1292 identifiable and map-able. In effect what Homan did was to convert the rental from its written form to a cartographic plan.
William Homan undertook his work on Winchelsea in the 1930s and '40s, and left a large body of unpublished material on the town's early history and topography.[445] He, like Thomas Tout before him and Maurice Beresford after him, drew upon the documented process of Winchelsea's planning, but said relatively little about how the town's design was drawn up and laid out on the ground in the 1280s.[446] In other words, little work has been done on interpreting the town plan itself. What has been done by many, however, is to compare Winchelsea's layout with the bastide towns of Gascony in south-west France. The basis for such comparisons is not at all surprising since at the same time that Winchelsea was being created the English were also establishing new towns in Edward's recently-acquired lands in Gascony, and certain individuals recorded working at Winchelsea are known to have had connections with Gascony either through their administrative work or as merchants. So the gridded layout of Winchelsea has been seen as deriving from a model provided by the bastides, an influence from abroad carried by the likes of Waleys or Rokesley.[447] This is a persistent view, fostered throughout the twentieth century by Thomas Tout, William Homan, Maurice Beresford, and since repeated in generalised accounts of medieval town planning.[448] It is due some reevaluation. To do this requires careful scrutiny of the layout of Winchelsea, and examination of the chronology of its formation and those individuals involved recorded by the contemporary sources.
As far the town's layout is concerned, it has had further work carried out on it by David Martin and Barbara Martin who have redrawn William Homan's plan of the town on the basis of further documentary and survey work.[449] A further physical survey of the town was undertaken in 2003 as part of the 'Mapping the medieval urban landscape' project to provide detailed field measurements of Winchelsea's surviving street and plot patterns.[450] With these two new studies it is possible to understand more about the design and plan of New Winchelsea, and begin to question the idea that its plan derived from a model of a Gascon bastide. What begins to emerge from this is the possibility that Winchelsea's plan was conceptualised in imitation of a bastide, but was not modeled on one.
Although Winchelsea's plan is a grid and highly regular in overall form, it is not a uniform layout and neither is it strictly orthogonal. It comprises five streets laid out in parallel and running approximately north-south, each spaced at a regular interval. Across these longitudinal streets are a series of latitudinal streets, each orientated more or less on an east-west alignment but showing more variation in their direction and spacing than the longitudinal streets. Three in the northern part of the town are on one alignment, two to the south are on another, and two further south are on yet another. So the latitudinal streets run on three different alignments. Only in the case of the northern-most streets are intersections close to being right-angled; elsewhere right angles are absent and the grid is skewed. This variation in street orientation produces a series of differently-sized and shaped street-blocks. These street-blocks are the 'chequers', or 'quarters', thirty-nine in all, listed in the 1292 rental, and the latitudinal streets are those likewise recorded in order, from north to south, as 'first street', 'second street', 'third...' and so on up to 'eighth street'. In the mind of the individual who completed the survey to draw up the 1292 rental, the streets and street-blocks of the town had an order, but on the ground in their layout this was not conveyed as a perfect abstract geometrical form, rather more simply as a series of various quadrilateral street-blocks, the thirty-nine 'quarters' that made up the town as a whole. This choice of layout reveals something of the approach and ideas of the individual(s) who came up with it in the first place, the various parties who were at work planning the town in the 1280s.
The differing orientations of the latitudinal streets and the variations in street-blocks have not gone unnoticed. William Homan suggested there were existing features that the town's surveyors had to take into account, giving rise to some streets having not quite straight alignments and not intersecting at right-angles: 'it may have been done in order to fit the layout to existing buildings or perhaps even to the roads of an older settlement', but was 'not due to carelessness or bad surveying'.[451] One of these buildings was a religious house belonging to the Franciscan friars. This was founded on land granted in c.1285, 'before the town was laid out', according to David Martin, causing a 'break in the symmetry of the street layout' around Grey Friars, such that 'their northern and western boundaries probably influenced the entire grid of the town'.[452] Certainly there were pre-existing parcels of land on the hill-top site, for these were what gave rise to so much protracted negotiation between landholders and the king's agents in the mid-1280s, as well as complaints over compensation. The commissions of involving Waleys, Rokesley, Penecestre and others in 1281 and 1283 were all concerned with these issues, and the 1292 rental itself makes it clear that various landholders in the manor of Iham had cultivated land and buildings.[453] Indeed, the complaint of 1303 levelled by Burgeys and Langhurst for their 35 acres 'within the site of the new town' covered a large portion of the hill-top.[454]
A process of protracted negotiation, coupled with the presence of existing landscape features, is likely to have caused the variations in the layout of the new town therefore. If so, they seemed to have concerned the southern portion of the town - where such variations are most noticeable - rather than the northern portion where the town plan is most regular and symmetrical. In the work Penecestre was asked to do in 1286, 'to lay out lots at fixed rents for dwelling purposes [at] a place called 'le kenel' for the enlargement of the town of Winchelsea', we perhaps have the evidence for this. The location of 'le kenel' is not known, and not indicated on early maps of the town. It probably lay in the southern part of what became the new town, for the 'enlargement' Penecestre was overseeing surely relates to a southward extension, adding further latitudinal streets south of the Greyfriar's precinct, where their alignments are most awry from those to the north, as well as laying out additional plots. The longitudinal streets were presumably already in place here, or at least their alignments were simply extended by Penecestre, for they show no significant deflection in orientation along their whole lengths. The town was seemingly enlarged, then, simply by placing further cross streets to form new street-blocks (quarters 23 to 39), their resulting odd shapes and alignments reflecting this additional stage in the laying out of the new town. The implication of this is that the plan of Winchelsea was laid out in two stages, the first taking place prior to 1286, but after 1283, and including the longitudinal streets and quarters in the northern half of the town (quarters 1 to 22), and the second taking place subsequently, during 1286, extending the town to the south once agreements were reached with landholders. The result is the largest of all the new towns of Edward's reign.
If Penecestre was responsible for laying out the southern part of the town in 1286, was he likewise influential in the northern part of the town? He was, after all, named in the earlier commissions of 1283. He also had to be able to 'lay out lots at fixed rents', and since this was required for the town as a whole it makes sense to see him as the person who had done likewise in the northern quarters too. He was doing this in 1286, so why not in 1283 as well? This might be why the longitudinal streets are on one single alignment - if he was simply extending what he had already begun. There are other contenders however. Not least Waleys and Rokesley, who were also named in the October 1283 commission 'to plan and give directions' for the new town's streets and lanes, market places and churches. The specific wording of this commission is telling in this regard. The instruction was 'for places suitable for a market, and for two churches... as there are in the aforesaid town of Winchelsea'.[455] Just as the three men were instructed so provision was made for these in the layout of the new town - the Monday market being one of the places for a market, located just to the west of Grey Friars, with two further street-blocks accommodating St Thomas' church and St Giles'.[456] But who had decided on them? Were the three men simply following orders and following through a predetermined plan? Or are they being told what to include but using their own design which met the stated requirements? No doubt the barons of old Winchelsea had a say in this too, for it was their 'replacement' town, and it was their own properties, church and market, that had to be replicated in the new town.[457] It may be, then, that they were dictating how the new town should look. The role of the three agents begins to look more like they were acting as intermediaries, being told first what the new town should contain, and to 'give directions' to others to do the work. Of the three, perhaps Penecestre was most key, hence the task he was assigned to do in 1286, in effect to continue what he had already begun.
But assigning the planning of the new town to any one individual is perhaps erroneous. It may instead be wiser to view the layout of New Winchelsea as the product of many hands, and the culmination of many discussions, just as is the case with town planning today. The decision-making included a range of people from across the political and social hierarchy of Edward's realm, from the bureaucrats of the royal household to the local barons and property-holders. Some of these individuals, the most high-ranking, are better represented in the documentary record. John de Kirkby is one such official, who in July 1288, 'on behalf of the king, had delivered seisin of the land to the commonalty' - giving the community of the new town legal possession.[458] Earlier, too, Kirkby had been overseeing matters. The letter patent of 1303, in which the complaint of Burgeys and Langhurst was being heard, refers also to 'John, sometime bishop of Ely, the treasurer, to whom the ordering of the new town was assigned'.[459] The complaint related to lands being exchanged and compensated for in 1283, or shortly thereafter. He was Lord Treasurer in 1284, bishop of Ely in 1286, and died in 1290.[460] Between 1284-5 he was undertaking a survey of lands in Yorkshire on behalf of the king.[461] Kirkby's role in the 'ordering' of New Winchelsea in 1283-4 was around the time at which land exchanges were being carried out and instruction issued to Penecestre, Rokesley and Waleys 'to plan and assess the new town'.[462] This latter would have coincided just prior to his appointment as Lord Treasurer, when he was 'chancery clerk' serving as 'right-hand man' to Robert Burnell, the king's chancellor between 1274 and 1292 - the 'greatest post' in the king's administrative service.[463] Either as clerk in 1283, or as treasurer in 1284, Kirkby 'was in intimate relation with the king'.[464] Through Kirkby, the planning of New Winchelsea was thus connected to the highest authority in the land.
The ordered plan of the new town, with its grid of streets and plots 'laid out at fixed rents', has the characteristics that might be associated with the thinking of an exchequer clerk, an accountant. The gridded layout itself facilitating the computation of rents and areas, carefully recorded in tabulated form in the 1292 rental, quarter by quarter, plot by plot. The design of the town plan, then, might be viewed as a product of bureaucratic thinking - a 'rational' solution to a practical problem. This indeed has been argued.[465] Certainly a man such as Kirkby, well used to dealing with drawing up lists and working out sums, as he did in the Yorkshire survey, might have approached the problem of relocating a town in this 'logical' way. Alternatively, Kirkby's 'ordering of the new town' may have been more of an instruction - an order - rather than a physical ordering of the town's layout; an instruction to others, men such as Penecestre, Rokesley and Waleys, who themselves were to 'give directions' on the town plan. These administrative documents seem to keep pointing down a hierarchical chain of command, therefore, from the top of the royal household down through appointed agents working locally, and no doubt down yet further to those with the expertise and skills to lay out a new town. The problem is these latter individuals are hidden from view. But there are indications in the town's plan that may help. Its design, for example, shows an aesthetic sensibility at work. This took geometrical form, of straight streets and neat right angles, and a concern for regularity (at least in the northern-most (earliest?) part of the town). The later thirteenth century is known to have been a time when these attributes were considered to be important to convey ideas about beauty and dignity, for civic pride.[466] The loss of old Winchelsea provided an opportunity to create a new more impressive urban landscape, and restore the status of the town 'as a port most valuable to the English' following the troubles the barons had experienced in the 1270s, including their falling revenues.[467] In making the town spacious and ordered, the formal, quadrilateral layout marked a new beginning. In this context, it is perhaps not without significance that geometrical forms such as the square had symbolic meaning, as demonstrated in contemporary illustrations of the heavenly Jerusalem, the celestial city.[468]
It is therefore possible to offer various interpretations of the regular and ordered plan of New Winchelsea. To see it on one hand as the product of a functional, rational bureaucrat trying to make a town's shape relate as closely as they can to the tabulated lists of accounts they had to use to keep an eye on revenue and landholdings; and on the other as a model urban form imbued with an aesthetic based on geometry and pointing to a symbolism that conveyed the order of God's universe and the archetypal city of Jerusalem. It is easier to pin more credence to the former than the latter as we know of individuals working at New Winchelsea, such as Kirkby, who could have seen the planning of the new town this way, whereas no mention is made of architects or masons designing the town who might have had the necessary skills and ideas to take an approach that drew upon contemporary aesthetic theory. Only in other parts of Europe is such evidence forthcoming.[469]
The plan of New Winchelsea itself does of course offer some clues as to the nature of its designer(s), and this relates to the idea that its layout is derived from the bastide towns of Gascony. There are parallels between them. In particular, Winchelsea's grid of streets, the Monday market accommodated within a square of its own defined by streets entering into it at each corner, the overall regularity in the plan of the town, and the very fact it is a 'new town', are all characteristic of bastides such as Monpazier, Molières, and Beaumont du Périgord in the English-held Agenais of Gascony.[470] Such towns were foundations contemporary with New Winchelsea. But the bastides of 'French' Gascony also shared these attributes.[471] So singling out those men such as Waleys and Rokesley who had connections with English Gascony in the 1270s and 1280s as possible originators of Winchelsea's design begins to look more suspect, unless they were simply familiar with the general concept of the bastide layout rather than attempting to create a facsimile of one. But in its details Winchelsea's plan has also some anomalies that mark it out as different from the Gascon bastides. Two of the most significant differences are, firstly, the lack of evidence for what in the bastides are called 'carreyrous', small lanes running behind plot-frontages and which form a characteristic T-shape in street-blocks facing the market place, and secondly the presence at Winchelsea of St Thomas' church in one whole 'chequer'. In the bastides, churches are commonly positioned in a corner close to and overlooking the market square, as at Monpazier, or else occupy small portions of street-blocks located further away from it, as at Molières.[472] In some cases, as at Laparade, they sit in the market square itself.[473] It maybe that at Winchelsea St Thomas' was located in a square also intended to be a market. After all, the instruction issued in October 1283 was for 'places suitable for a market', the plural suggesting there was more than one market place in mind.[474] Examples of churches occupying a whole chequer to themselves in the Gascon bastides are however hard to find.
Despite the differences in detail between the characteristics of Winchelsea and the layouts of the bastides of south-west France, there are superficial similarities. There are also the Gascon connections personified through Waleys and Rokesley. Considering the clear role these men had, 'to plan and give directions' for the town's streets, markets and churches in October 1283, it would be naïve to deny the possibility that Winchelsea was designed to look like a bastide, but it would also be unreasonable to over-egg the evidence and argue that the town plan was based upon some bastide familiar to each or all of them. More likely, if indeed it is accepted that these individuals had a direct role in laying out the new town, the resemblance was based on their memory or idea of what a bastide looked like, and not a design blueprint. This then leaves the issue of how the town was laid out, and what this involved. Again the physical layout of New Winchelsea is revealing.
As William Homan notes, 'we do not know the methods or means by which a survey was carried out in the thirteenth century, nor do we know if a plan (it would not be drawn to scale) was made on parchment recording the survey or the laying-out of the town'.[475] He suggests the town was laid out with 'rods or other means of measuring', possibly 'one half virga in length', a virga he suggests being 'about 16 feet 3 inches in length'.[476] Maurice Beresford suggests 'the use of a line to lay out the hill-top at New Winchelsea', as 'rope was certainly bought for this purpose by Edward I's officials elsewhere'.[477] The virga though is the unit used in the 1292 rental to calculate the areas of the plots in the town. It is a measure of area and not distance. In Homan's attempt to map the layout of Winchelsea from the rental, the virgae enumerated listed against people's names were key to enabling him to work backwards from the document to the areal extent of the properties. This does not of course mean that this particular unit of measurement, the virga, was used to lay out the town. It simply means that it was used by the surveyor in 1292 to calculate the size of each property on the ground. By then the town's plots were already laid out. So which unit of measurement was used to plan the town? In England in the twelfth and thirteenth centuries a frequently-used measure in town planning was the perch, a linear measure.[478] While regional variations in the perch meant that it could range between 15 feet and 22 feet in length, in the reign of Edward I it had become a statute measure of 16½ feet, or 5½ yards.[479] As Maurice Beresford notes, one square-perch equates with one virga, for it was '1/160 part of an acre, or 30¼ square yards', a square measuring 5½ yards on each side, 'the square pole of the arithmetic books'.[480] So by this calculation the virga at Winchelsea was one-perch square, making it likely that a statute perch of 16½ feet had been used to lay out the town. However, this differs from Homan's suggestion that the virga used at Winchelsea was 16 feet and 3 inches - three inches less than the statute perch.[481] In all, therefore, not only is there uncertainty over what the actual size of virga was at Winchelsea (according to either Homan or Beresford), there is also a question mark over whether a linear measure was used in its planning, and if so which one.
Measurements of the town plan were undertaken in 2003 to calculate the dimensions of street-blocks and plot frontages for each of the complete quarters still surviving in the northern part of the town (quarters 1-3, 7-9, 13-14).[482] These were compared with the areas recorded in the 1292 rental. This revealed that the virga used in 1292 was around 25m². It is not possible to determine, though, which of the two virgae sizes suggested by Homan or Beresford is correct, as three inches is too small a margin of error to deduce from field survey measurements made of 700 year-old street-blocks.[483] However, what the field measurements do indicate is that the surveyors who drew up the 1292 rental were accurate in their work, since their calculations closely match those recorded by the 2003 survey.[484] It is also possible to use this figure of 25m² to work out the extent of the town's street blocks that are no longer inhabited, those 'lost' quarters that lie in the southern half, and which exist today only as earthworks in empty fields. Using the earthwork remains to indicate where the streets once ran in this area, and by calculating the extent of the 'lost' street-blocks, the modern measurements taken in the field again compare favourably with those recorded in 1292 for each quarter. Using these new results the shapes of the 'lost' quarters mapped-out by Homan and Martin need to be altered slightly. To establish whether a linear measure was used in the town's planning requires some statistical analysis of field measurements made of surviving plot frontages and street-blocks.[485] This in fact reveals the common occurrence of a 20-foot measure. If a single linear measure was used originally it may have been the regional perch-unit of twenty feet, rather than the statute perch of 16½. The alternative is to see the town being laid out using the virga, or square perch, used to survey the properties in the town for the 1292 rental. In the context of medieval town planning, however, this method would be unusual.
Apart from questions about which unit of measure was used to lay out New Winchelsea there are also uncertainties concerning the procedure that was followed by the surveyors. Once more, Homan provides an interesting possibility. He suggests that 'the surveyors appear first to have determined the positions of the streets', and then 'a strip of ground five poles wide was measured off along the south side and along the north side of each [street] block'.[486] These two 'strips were then subdivided into suitably sized plots', and the 'part of the block between the two strips... divided by a north-south line and the ground on either side of this line... also subdivided into plots'.[487] This then created the characteristic pattern of plots within the quarters that Homan shows on his reconstruction map showing the town in 1292. Martin and Martin have since revised some of Homan's plot patterns, and hence theirs are used here, though with some alterations to better fit the street-block areas derived from the 2003 field-survey data.[488] There is no reason to doubt the sequence of planning that Homan suggests in his analysis. Setting out streets first must have required some prior consideration of the quantity and size of plots that the street blocks were to contain, so perhaps we might envisage a design stage when the layout was worked out on parchment before being laid out on the ground. The ability to work 'off plan' in ground-surveys would surely have been possible for the surveyors of the time since they were clearly able to do the reverse when measuring areas of plots to create a list in the form of the 1292 rental. What is more, as the field survey has shown, there was a high degree of accuracy on the part of the surveyors who worked in Winchelsea. This again makes it all the more unlikely that agents and administrators such as Waleys or Rokesley were up to the job, and more likely they secured specialists to do the actual work, no doubt in consultation. This was probably undertaken soon after the agreements with local landholders had been reached, during the mid 1280s. The arrangement that they came up with was similar to and reminiscent of a Gascon bastide, but not a straightforward copy of one. There is a hint that a castle was intended for the area around St Leonard's church - the old town of Iham.[489]
The design and plan of New Winchelsea is full of interest. It is not a simple layout. It seems to have been laid out in two stages, the northern part of the town being the earliest. From the start in terms of its content it was conceived to be a layout that replicated what had existed at 'old' Winchelsea, but drawn anew to a more geometrical design. Whether this was chosen for its practical advantages or for aesthetic reasons (perhaps both) can be debated. Who produced the design is likewise contentious, though a process of negotiation is evident. What is for sure is that the surveyors of the time had the skills and ability necessary to undertake accurate setting out. Who they are is not documented in the various records the town's relocation left to us, but the chances are they were not the particular individuals that are named in the commissions and appointments issued by the Crown. Their role was more as administrators, or overseers, of the process. If there was one person who did perhaps play a key role in this regard it was Penecestre, Warden of the Cinque Ports. In this position he would have been the man the barons of Winchelsea would have looked to first, and in whom they would perhaps place most trust. The town that they ended up with may show passing resemblance to a bastide town in its general appearance, but it seems unlikely, even with their Gascon connections, that the king's agents were working from a blueprint they gained from say Monpazier or Beaumont. More likely, to them, and to others, a new town was understood at the time to have a particular shape by definition, a regular layout of rectilinear street and plot patterns, an 'ordered' townscape.
[top]
The town as it is today
New Winchelsea is an evocative and atmospheric place but nowadays rather gentrified. Only less than half of the original area occupied by the Edwardian new town is now lived in and made up of houses and streets. The grid plan here, in the northern half of the town, is especially clear. In the southern, unoccupied part of the town the lines of former streets and the 'lost' quarters can still be traced as earthworks in field or as field boundaries and paths. These were carefully surveyed by the Royal Commission on Historical Monuments of England (RCHME) in 1996.[490] The site of the Monday market is viewable from the public highway, though much of the decayed part of the town is not accessible without permission via the current landowners, The National Trust.
Winchelsea has good surviving remains of late thirteenth century buildings that were put up shortly after the town was moved to the new site, including the remains of three of the four original town gates (New Gate, Strand Gate and Pipewell Gate), the church of St Thomas (now reduced to half its former size), an end gable of St John's Hospital, the church of Grey Friars, as well as stone-built vaulted undercrofts (32 of which survive under houses in the northern part of the town, while others exist even though the building above has gone).[491] These standing remains and the town's archaeology in general, have been surveyed as part of an English Heritage and National Trust initiative, the details of which are in the volumes by David and Barbara Martin.[492] Archaeological excavations of the town's plots have revealed their internal structures with boundary ditches and fences, as well as the original road surfaces of stone paving and gravel.[493] There is a remarkable continuity in the townscape of New Winchelsea, not only in the survival of buildings contemporary with the founding of the town, such as the parish church and town gates, but also the layout of streets, the 'quarters', and in some cases the plots too. This makes it possible to visualise the town as it was even though it is now a shadow of its former self. Despite having few urban attributes, Winchelsea is nevertheless still regarded locally as a town, and rightly so. On a summer's day, with the sun shining, it even feels like a Gascon bastide.
[top]
References:
- M.W. Beresford and J.K.S. St Joseph, Medieval England: an aerial survey (Cambridge University Press, Cambridge, 1958), p.221.
- For example: R. Unwin, Town Planning in Practice - an introduction to the art of designing cities and suburbs (Fisher Unwin, London, 1909); T.H. Hughes and E.A.G. Lamborn, Town Planning: Ancient and Modern, Oxford University Press, Oxford, 1923); Tout, Mediaeval Town Planning, pp.23-6; C.E. Chambers, 'The French bastides and the town plan of Winchelsea', Archaeological Journal 94 (1938), pp.177-206; W. Maclean Homan, 'The founding of New Winchelsea', Sussex Archaeological Collections 88 (1949), pp.22-41; Beresford, New Towns, pp.14-27; D. Martin and B. Martin, Quarter-by-Quarter Analysis of Winchelsea, East Sussex (Archaeology South-East, unpublished report, University College London, 2002); D. Martin and B. Martin, An Extensive Urban Survey Assessment of Winchelsea, east Sussex (Archaeology South-East, unpublished report, University College London, 2002); D. Martin and B. Martin, New Winchelsea, Sussex. A medieval port town (Heritage Marketing, Kings Lynn, 2004); D. Martin and D. Rudling (eds.), Excavations in Winchelsea, Sussex 1974-2000 (Heritage Marketing, Kings Lynn, 2004).
- On 'old' Winchelsea see Victoria History of the Counties of England, Sussex, volume 9, the Rape of Hastings, ed. L.F. Salzman (Oxford University Press, London, 1937), pp.62-3, 67; Martin and Martin, Extensive Urban Survey, pp.4-5.
- CPR 1247-58, p.39; Victoria History, Sussex, 9, p.63, citing Matthew Paris, Chronica majora (1247-50).
- CChR 1257-1300, p.177.
- CPR 1272-81, p.151. Cf. CPR 1281-92, pp.16, 62.
- Beresford, New Towns, p.19.
- CPR 1272-81, p.414.
- CPR 1272-81, p.414.
- Homan, 'Founding of new Winchelsea', pp.24-5. See also CClR 1279-88, pp.509-10.
- Homan, 'Founding of new Winchelsea', pp.24-5. Homan locates the 'little town of Iham' on the west slopes of the hill (p.26). It was a rural settlement and not a town in the modern sense of the term. Fécamp's holding of lands in this area dated back to before the Norman conquest; Victoria History, Sussex, 9, p.62.
- CPR 1281-92, p.3.
- See Prestwich, Edward I, p.307; G.A. Williams, Medieval London. From commune to capital (Athlone Press, London, 1963), p.330. On The Cinque Ports see Victoria History, Sussex, 9, pp.34-39.
- Williams, Medieval London, pp.333-35.
- Prestwich, Edward I, p.431.
- CPR 1281-92, pp.58-9.
- Beresford, New Towns, p.19.
- For example, Tout, Mediaeval Town Planning, p.24; Homan, 'Founding of new Winchelsea', pp.22-3; Beresford, New Towns, p.19.
- CPR 1281-92, pp.81-2.
- Williams, Medieval London, pp.330-31
- Williams, Medieval London, pp.330-31.
- CPR 1281-92, p.225.
- See below, 'Design and plan of the town'.
- CPR 1281-92, p.225.
- Victoria History, Sussex, 9, p.63. Thomas Stonham's map of 1599 shows the position of 'owlld winshallse drowned', see Victoria History, Sussex, 9, opposite p.34.
- Victoria History, Sussex, 9, p.67; Homan, 'Founding of new Winchelsea', pp.28-37, plus map. See also Martin and Martin, Quarter-by-Quarter Analysis.
- Homan, 'Founding of new Winchelsea', p.28. Curiously, Homan did not refer to the mandate issued to Penecestre in 1286.
- CClR 1279-88, pp.509-10, also CFR 1272-1300, p.249.
- Prestwich, Edward I, p.234; Victoria, History, Sussex, 9, p.67; Homan, 'Founding of new Winchelsea', p.28.
- VCH Sussex, p.67.
- Martin and Martin, Extensive Urban Survey, p. 32, citing PRO: SC 11/673.
- CPR 1301-1307, p.185.
- CPR 1301-1307, p.185.
- See Beresford, New Towns, pp.27-8; Martin and Martin, Extensive Urban Survey, pp.8-12; Martin and Martin, New Winchelsea, passim.
- Martin and Martin, Extensive Urban Survey, pp.18, 22, 24-31.
- Martin and Martin, Extensive Urban Survey, p.22; Martin and Martin, New Winchelsea, p.41.
- Martin and Martin, Extensive Urban Survey, p.22-3, figures 7, 8 and 9; also Martin and Martin, Quarter-by-Quarter Analysis, passim, has details of the late medieval and post medieval histories of the town and its properties.
- Tout, Mediaeval Town Planning, p.26.
- PRO: SC 11/674.
- Homan, 'Founding of new Winchelsea', p.28 et seq.
- See Winchelsea Corporation Records - a catalogue, ed. R.F. Dell (East Sussex County Council, Lewes, 1963), pp.82-6. Homan's collection is housed at East Sussex Record Office.
- Tout, Mediaeval Town Planning, pp.23-6; Homan, 'Founding of new Winchelsea', p.30, 39; Beresford, New Towns, pp.14-28. Homan remarks: 'we do not know the methods or means by which a survey was carried out in the thirteenth century, nor do we know if a plan (it would not be drawn to scale) was made on parchment recording the survey or the laying-out of the town' (p.39).
- On the lives and Gascon connections of these two particular men see Williams, Medieval London, pp.330-335.
- Tout, Mediaeval Town Planning, p.25; Homan, 'Founding of new Winchelsea', p.22; Beresford, New Towns, pp.28-9; Morris, History of Urban Form, pp.98-100. Morris uses the term 'bastide' to describe Edward's new towns - which is not strictly-speaking correct.
- Martin and Martin, Extensive Urban Survey; Martin and Martin, Quarter-by-Quarter Analysis. See also Martin and Martin, New Winchelsea, pp.25-28, 94-100.
- K.D. Lilley, C. Lloyd, S. Trick and C. Graham, 'Analysing and mapping medieval urban forms using GPS and GIS', Urban Morphology 9 (2005), pp.5-15; see also 'Data downloads'.
- Homan, 'Foundation of new Winchelsea', p.34.
- Martin and Martin, Extensive Urban Survey, pp.14-15; Martin and Martin, New Winchelsea, p.30.
- CPR 1281-92, pp.3, 58-9; Homan, 'Foundation of new Winchelsea', pp.24-5.
- CPR 1301-1307, p.185.
- CPR 1281-92, pp.81-2.
- On the market and church sites see Martin and Martin, New Winchelsea, pp.25-36, 74-82.
- 'Old' Winchelsea had a St Thomas' church, CChR 1257-1300, p.177. On the churches in New Winchelsea see Victoria History, Sussex, 9, pp.71-5; Martin and Martin, New Winchelsea, pp.73-83; also D. Rudling, 'Archaeological investigations at St Giles' churchyard', in Martin and Rudling (eds.), Excavations in Winchelsea, pp.75-93.
- Victoria History, Sussex, 9, p.67.
- CPR 1301-1307, p.185.
- Tout, Chapters in Administrative History, ii, p.13; Survey of the County of York, ed. R.H. Skaife (Surtees Society, Durham, 1867), pp.xi-xiii.
- Survey of the County of York, ed. Skaife, p.viii.
- CPR 1281-92, pp.81-2.
- Tout, Chapters in Administrative History, ii, pp.11, 13.
- Tout, Chapters in Administrative History, ii, p.11.
- Beresford, New Towns, p.16; A. Randolph, 'The bastides of south-west France', Art Bulletin 78 (1995), pp.291, 306.
- See K.D. Lilley, Urban Life in the Middle Ages 1000-1450 (Palgrave, London, 2002), pp.167-75.
- Victoria History, Sussex, 9, p.63.
- K.D. Lilley, 'Cities of God? Medieval urban forms and their Christian symbolism', Transactions of the Institute of British Geographers 29 (new series) (2004), pp.296-313.
- D. Friedman, Florentine New Towns. Urban design in the late middle ages (MIT Press, London, 1988).
- Lauret et al, Bastides, pp.66-7, 283.
- Lauret et al, Bastides, pp.63-78.
- Lauret et al, Bastides, pp.66-7.
- Lauret et al, Bastides, p.67.
- CPR 1281-92, p.81. See also Martin and Martin, Extensive Urban Survey, p.17, who note that the area around St Thomas' was used as a market in the sixteenth century.
- Homan, 'Founding of new Winchelsea', p.39.
- Homan, 'Founding of new Winchelsea', pp.28-9.
- Beresford, New Towns, p.16. He presumably is referring here to the rope bought in 1287 for the laying out of the bastide of Baa near Bordeaux: see J.P. Trabut-Cussac, 'Date, foundation et identification de la bastide de Baa', Revue Historique de Bordeaux 10 (1961), p.141.
- T.R. Slater, 'Ideal and reality in English Episcopal medieval town planning', Transactions of the Institute of British Geographers 12 (new series) (1987), pp.191-203; P. Crummy, 'The system of measurement used in town planning from the ninth to the thirteenth centuries', in S.C. Hawkes, D. Brown and J. Campbell (eds.), Anglo-Saxon Studies in Archaeology and History (British Archaeological Reports, British Series 72, Oxford, 1979), pp.149-63.
- See P. Grierson, English Linear Measures (The Stenton Lecture, University of Reading, 1972), pp.4-24.
- Beresford, New Towns, p.18.
- Martin and Martin, New Winchelsea, p.96, assume that a virga is derived from a statute perch.
- For more information on this see Lilley et al, 'Analysing and mapping medieval urban forms'.
- It is worth noting, though, that in excavations of Plots 10-12 in German Street in 1974 the frontage of the property calculated from the 1292 rental was 'just 700 millimetres (two feet and four inches) greater than [that] indicated by the excavation', D. Martin and B. Martin, 'Excavations at German Street, 1974: Quarter 19, plots 10-12', in Martin and Rudling (eds.), Excavations in Winchelsea, p.2. This calculation was based on one virga being one square-perch of 16½ feet.
- For the 2003 survey data see 'Data downloads'.
- Lilley et al, 'Analysing and mapping medieval urban forms'.
- Homan, Founding of new Winchelsea', p.30.
- Homan, Founding of new Winchelsea', pp.30-1.
- Thanks to David Martin for his kind permission allowing us access to his work. See Martin and Martin, Extensive Urban Survey, figure 4. Also Martin and Martin, Quarter-by-Quarter Analysis.
- For this see Martin and Martin, 'Extensive Urban Survey', pp.22-3.
- Martin and Martin, Extensive Urban Survey, p.7, figure 16. The original plans are kept at the National Monuments Record, Swindon.
- Martin and Martin, Extensive Urban Survey, pp.37-43.
- Martin and Martin, Extensive Urban Survey; Martin and Martin, Quarter-by-Quarter Analysis; Martin and Martin, New Winchelsea.
- Martin and Rudling (eds.), Excavations in Winchelsea, passim; R. James, 'St Thomas' School site. Examining a medieval burgage plot in Winchelsea', Sussex Past and Present, December 2004, pp.9-10.
[top]
Downloads:
The following supplementary material is available for download:
- Core maps [info ]
- Supplementary images [info ]
- GIS data [info ]
- Discussion papers [info ]
For further information on downloading and using this data, please see our Viewers and Download support pages.
Core maps:
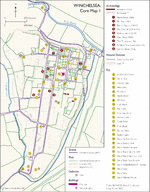
Winchelsea_1.jpg
Winchelsea core map 1: Available reliable map information
[DOWNLOAD] right-click and save link |
Winchelsea core map 1: Available reliable map information |
JPG
Winchelsea_1.jpg
Winchelsea core map 1: Available reliable map information
[DOWNLOAD] right-click and save link |
3,025Kb 1,921Kb |
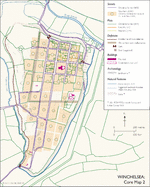
Winchelsea_2.jpg
Winchelsea core map 2: Proven and conjectured medieval features
[DOWNLOAD] right-click and save link |
Winchelsea core map 2: Proven and conjectured medieval features |
JPG
Winchelsea_2.jpg
Winchelsea core map 2: Proven and conjectured medieval features
[DOWNLOAD] right-click and save link |
3,034Kb 1,887Kb |
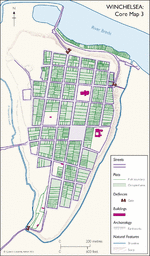
Winchelsea_3.jpg
Winchelsea core map 3: The town as it looked c.1300
[DOWNLOAD] right-click and save link |
Winchelsea core map 3: The town as it looked c.1300 |
JPG
Winchelsea_3.jpg
Winchelsea core map 3: The town as it looked c.1300
[DOWNLOAD] right-click and save link |
2,340Kb 342Kb |
[top]
Supplementary images:
3D version of core map 3
win3d_recon.jpg
[DOWNLOAD] (Full Resolution) right-click and save link |
3D version of core map 3 |
JPG
3D version of core map 3
win3d_recon.jpg
[DOWNLOAD] (Full Resolution) right-click and save link |
157 Kb |
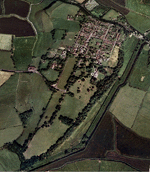
Modern aerial photograph in 3D
3d_ap.jpg
[DOWNLOAD] (Full Resolution) right-click and save link |
Modern aerial photograph in 3D |
JPG
Modern aerial photograph in 3D
3d_ap.jpg
[DOWNLOAD] (Full Resolution) right-click and save link |
480 Kb |
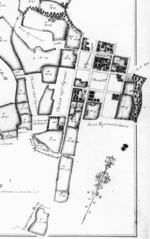
Nesbitt estate map 1767(detail)
nesbitt1767.jpg
[DOWNLOAD] (Full Resolution) right-click and save link |
Nesbitt estate map 1767(detail) |
JPG
Nesbitt estate map 1767(detail)
nesbitt1767.jpg
[DOWNLOAD] (Full Resolution) right-click and save link |
66 Kb |
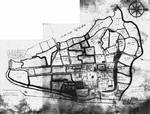
Stephens map 1758 (detail)
stephens1758.jpg
[DOWNLOAD] (Full Resolution) right-click and save link |
Stephens map 1758 (detail) |
JPG
Stephens map 1758 (detail)
stephens1758.jpg
[DOWNLOAD] (Full Resolution) right-click and save link |
165 Kb |
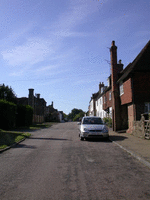
Photograph of view south along Castle Street
castle_str_looking_s.jpg
[DOWNLOAD] (Full Resolution) right-click and save link |
Photograph of view south along Castle Street |
JPG
Photograph of view south along Castle Street
castle_str_looking_s.jpg
[DOWNLOAD] (Full Resolution) right-click and save link |
58 Kb |
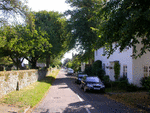
Photograph of view east along Back Lane
look_e_down_back_lane.jpg
[DOWNLOAD] (Full Resolution) right-click and save link |
Photograph of view east along Back Lane |
JPG
Photograph of view east along Back Lane
look_e_down_back_lane.jpg
[DOWNLOAD] (Full Resolution) right-click and save link |
209 Kb |
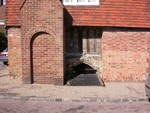
Photograph of medieval cellar entrance, Quarter 2
win_cellar_q2_1.jpg
[DOWNLOAD] (Full Resolution) right-click and save link |
Photograph of medieval cellar entrance, Quarter 2 |
JPG
Photograph of medieval cellar entrance, Quarter 2
win_cellar_q2_1.jpg
[DOWNLOAD] (Full Resolution) right-click and save link |
189 Kb |
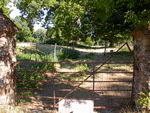
Photograph of Seventh Street as it appears today
SEVENTH_STREET.jpg
[DOWNLOAD] (Full Resolution) right-click and save link |
Photograph of Seventh Street as it appears today |
JPG
Photograph of Seventh Street as it appears today
SEVENTH_STREET.jpg
[DOWNLOAD] (Full Resolution) right-click and save link |
230 Kb |
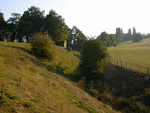
Photograph of town defensive ditch and rear of New Gate
ditch_holy_rood_newgate.jpg
[DOWNLOAD] (Full Resolution) right-click and save link |
Photograph of town defensive ditch and rear of New Gate |
JPG
Photograph of town defensive ditch and rear of New Gate
ditch_holy_rood_newgate.jpg
[DOWNLOAD] (Full Resolution) right-click and save link |
136 Kb |
[top]
GIS data:
The GIS data is also available to download and import into a desktop GIS for offline analysis. The files are available as ESRI shapefiles but have been zipped up for ease of download.
Archaeology
| Urban Survey 1292 (rental modified) | ZIP | 54Kb |
| Earthworks RCHME | ZIP | 2,963Kb |
| Excavations | ZIP | 3Kb |
| Gates Urban Survey | ZIP | 2Kb |
Metrics
| Plot fronts | ZIP | 22Kb |
| Street line | ZIP | 36Kb |
Plan Elements
| Buildings | ZIP | 3Kb |
| Plots | ZIP | 28Kb |
| Streets | ZIP | 15Kb |
| Water | ZIP | 3Kb |
Survey Data
| GPS | ZIP | 23Kb |
[top]
Discussion papers:
| Early history of the town | 194Kb | |
| Design and plan of the town | 246Kb | |
| The town as it is today | 108Kb |
[top]


