Mapping the Medieval Townscape: a digital atlas of the new towns of Edward I
Keith Lilley, Chris Lloyd, Steve Trick, 2005. https://doi.org/10.5284/1000022. How to cite using this DOI
Data copyright © Dr Keith Lilley, Chris Lloyd, Steve Trick unless otherwise stated
This work is licensed under the ADS Terms of Use and Access.
Primary contact
Dr
Keith
Lilley
School of Geography
Queen's University Belfast
University Road
Belfast
BT7 1NN
Northern Ireland
Tel: 0208 902 73363
Fax: 0208 903 21280
Resource identifiers
- ADS Collection: 433
- DOI:https://doi.org/10.5284/1000022
- How to cite using this DOI
Overview
The Maps
There are no maps contemporary with the time of the foundation of Edward’s new towns. This is to be expected as prior to the sixteenth-century town maps are rare in Europe. The earliest maps to show what the new towns looked like post-date their origins by over three hundred years. Some maps of the larger towns exist by the seventeenth century, notably those by John Speed of 1610-11. A few more exist for the eighteenth century, but really it is not until much later, from the middle of the nineteenth century onwards, that the first accurately-surveyed and detailed plans covering all the towns begin to appear. These were the work of the Ordnance Survey, and they show in map-form the surviving medieval layouts of the new towns, albeit a full six centuries after their initial formation. It has in fact been long recognised by geographers that Ordnance Survey mapping of the late-1800s can be used as a basis to map what medieval urban landscapes looked like. This is because the urban landscape is inherently conservative and preserves within it traces of its early development. This means that when we study an urban landscape today – whether through maps, aerial imagery, or in the field – it is possible to find evidence that tells a story of how the town was originally formed. The maps used in this atlas help to tell such stories.
Without having contemporary maps to show what medieval towns looked like at the time, new maps have to be created. This is what this atlas aims to provide: maps of each of Edward’s new towns showing their size and extent, layout and topography, as they were in circa 1300, shortly after or around the date of their foundation. Creating such maps is difficult, as it requires us to use evidence from a variety of different sources, including modern mapping, historic mapping, archaeology, field-survey, and documentary material. This historical atlas uses modern mapping techniques to integrate these various data, and since much of what follows relies on these maps it is appropriate to offer here some explanation of how they were made and also how they should be viewed.
For each of the thirteen towns covered by the atlas there are three ‘core’ maps. Each is a detailed town plan showing particular features that make up its urban layout. The first core map contains proven and substantiated urban features, while the second adds in those features that are less certain and more conjectured. The third map builds on the first and second, and is an attempt at a ‘reconstruction’ of the town’s plan circa 1300. The reason for having these three maps is to make the mapping process transparent. So rather than simply having just one map, showing how the town looked circa 1300, other maps are used to reveal how it has been produced. Each core map thus represents a stage in the mapping process itself. This means that it is possible to identify the original sources used to make the atlas maps. This is important as all maps – including those contained in this atlas – need to be questioned and challenged. Through the three core maps, then, it is possible to track how we as map-makers have created our new maps of Edward’s medieval new towns.
[top]
The ‘core’ maps
All three of the core maps are a ‘composite’ of different geographical, archaeological and historical sources that collectively help us to get back to what the town looked like circa 1300. They show selected urban landscape features of the towns. These are likely medieval survivals and include urban features, such as the town’s streets, building plots, and key buildings, particularly churches and castles, town defences and gates, as well as topographic features, such as streams, rivers, shorelines and marshland. The information on the maps is drawn from data sources that are geo-rectified to one another in a Geographical Information System (GIS), a spatial database. Geo-rectified simply means that different layers of information about the towns’ layouts are overlaid, one on top of the other. (These layers can be accessed via the databases linked to the atlas pages below). The core maps are made up from elements selected from these various layers, but presented as a single composite map. All these layers share the same co-ordinate system, which is independently geo-referenced using survey data collected via a Global Positioning System (GPS). This ensures that the final maps are spatially accurate, and relate to modern spatial co-ordinates. As an aid to comparison, and for the sake of consistency, the three core maps are reproduced to the same scale for each town. However, the scale is fixed only on the maps that are downloadable as PDFs.
[top]
Core map 1: Available reliable map information
The first of the three core maps is a straightforward representation of selected information taken from the geo-rectified data sources contained in the GIS. It shows the spatial location and form of the town’s various medieval urban landscape features, and also the sources which are used to derive these features: in particular, which historic town maps are used to derive patterns of streets, plots and buildings; which architectural sources provide information on ground-plans of castle and town defences; and which sources of archaeological work, including excavations and surveys, are drawn upon. While the first core map itself does not add conjectural features, it is of course a partial picture, built up from the available reliable data that exists to map medieval townscapes. It is open to debate, but in the absence of contemporary medieval town maps it is all we have to go on. There are of course written, documentary sources that can add flesh to the bare bones of the town plan depicted on the core maps. Together with further study of the features of the town plan, written records help to create a fuller overall picture of the medieval townscape.
[top]
Core map 2: Proven and conjectured medieval features
The second of the core maps is derived directly from the first, but this time some of the gaps in the information about the town are filled. For example, the layouts of street and plot patterns often preserve the outline of former town defences. These are useful as a basis from which to postulate the alignments of long-since demolished town walls and gateways, especially if from medieval documentary sources we know that a particular place had such defences. Similarly, other lost features can be added, including former lines of watercourses and quaysides. It may be that in the future these postulated urban features will be proven by archaeological excavation, and that the maps of the towns in the atlas might help to locate their likely position. In cases where excavations have revealed a small section of town wall or ditch, the alignment can be extrapolated, perhaps linking it into other known sections of town defences, or those suggested by street and plot patterns. So the second core map is simply adding a layer of interpretation in order to try to reach back closer to the time of the town’s foundation. Documentary and archaeological work in the future may either support or refute this interpretation, but until then what is shown here is a reasonable basis from which to map out how Edward’s new towns looked just over six centuries ago.
[top]
Core map 3: The town as it looked c.1300
The final of the three core maps is an attempt to reconstruct each town as it may have appeared circa 1300, that is shortly after or around the time it had been established. The map includes the conjectured and substantiated features of both the first and second core maps. It is intended to be a more ‘realistic’ impression, in map-form, of how the town then appeared – a map, that is, that shows the town as if it were drawn by those living at the time but done according to modern cartographic conventions. The majority of Edward’s new towns were by then nearly a quarter of a century old. They were attracting inhabitants who had taken up the empty plots that had been created for them, and were building upon these their houses, workshops and sheds. As the king had intended, they were engaging too in the trading of goods and manufacturing crafts, as medieval townspeople generally did. Of the Edwardian new towns only one post-dates 1300. Newborough received its charter in 1303, giving it the legal status of ‘borough’. However, in common with many other new towns of this period it is likely its borough charter came after the town was created.
The aim of the third core map is to show each town in terms of their original features. However, there are gaps in our knowledge of the towns at this time that are difficult to fill. Maps are especially unforgiving as ways of displaying historical information. They too readily reveal the holes created by a lack of knowledge. Two features of the towns’ urban layouts highlight this, and are particularly difficult to reconstruct. First, the houses that people lived in, and secondly the building plots that contained their houses. This is an unfortunate paradox, as both were features that gave a place its urban character and both were also the most familiar, everyday domestic physical framework within which most of the townspeople and their kin operated. Although houses cannot be located on the maps, some building plots can. Some further explanation of why this is so is needed here.
No houses of 1300 date survive in the towns today. Some later-medieval buildings do still exist, but these are of fifteenth and sixteenth century date. So in the absence of evidence the maps of the towns have to show empty building plots where of course the townspeoples’ houses would once have stood (and where in fact buildings still stand today). These plots, on the other hand, may themselves date back to the late 1200s. Archaeological work has been carried out at Winchelsea and Conwy, for example, and here has shown that urban plot boundaries can and do date back to the time of the town’s foundation, and survive for long periods of time to end up shown on large-scale Ordnance Survey plans of the late 1800s. Also, in the better documented towns such as Caernarfon, written evidence exists for the plot sizes used when the towns were first laid out. Using field-measurements of building frontages it is possible to find these original plot dimensions still traceable in the plot patterns existing today. This shows longevity in the survival of medieval plot patterns, but of course it does not mean that every plot-boundary shown on an Ordnance Survey plan is of medieval date. So while the plot patterns shown on the ‘reconstructed’ core map are based on ‘real’ plot boundaries derived from these later maps, some but not all are the same as those building plots existing circa 1300. They are only indicative of the overall medieval arrangement of plots. Even so, all this reinforces the point that urban landscapes are inherently conservative, which actually makes mapping exercises such as this one possible. It reminds us that in these and other towns of medieval origin there is a long continuity in urban life. This legacy of bequeathed by our medieval forebears needs to be both respected and preserved for future generations.
[top]
Supplementary mapping
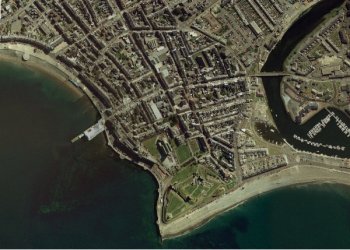
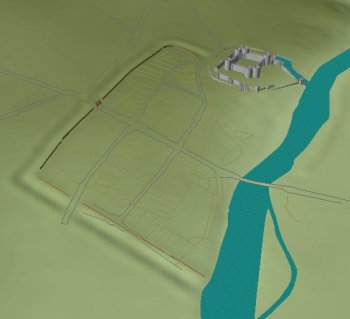
The three core maps are to be found for each of the towns covered by the historical atlas. As well as these there are other maps and visual representations of the towns. Some of these are modern aerial photographs with selected features from the core maps superimposed on them. This helps relate the reconstructed medieval townscape with the existing modern townscape. There are also selected examples of historic town maps and plans. Photographs of the towns as they are today are provided to give an indication of what the places look like at the turn of the twenty-first century, after six hundred years of urban development. These visual representations all contribute to convey an impression of the new towns through the ages. Rather though than relying on just two-dimensional images of the towns, there is scope for visualising them in three dimensions. The core maps make it possible to produce 3D views of the Edwardian new towns.
Maps have become an everyday means of depicting landscapes but, of course, such aerial views are a modern invention. In the middle ages there was no way for people to look down upon an urban landscape from above. The closest they could get to this would be by viewing a town from a castle turret or church tower, or possibly a nearby high hill if there was one. But viewing in three dimensions is helpful as a way of depicting landscapes more realistically, to make them appear more real. For this reason, the towns in the atlas are each presented as a three-dimensional aerial view. This is derived directly from the third of the core maps – the ‘reconstruction’ map of circa 1300 – using elevation data derived from Radar remote sensing. It offers the advantage of being a more accessible way of visualising townscapes than conventional maps that only show the world only in two dimensions. We can get a better sense of natural topography, for example, of how a particular town fits to its local landscape, respecting watercourses, making use of slopes and hills. It also enables us to view the townscapes from alternative angles, to give different perspectives on the place. These are all very revealing, as well as bringing the mapped information to life. There are limits however. Bear in mind the difficulties of creating the core maps in the first place – the gaps in our knowledge. The three-dimensional views are impressionistic and illustrative, and should be seen for what they are. Nevertheless, perhaps they do help to bring us a little closer to what the new towns originally looked like, even if people at the time could not have seen their towns this way.
[top]


