E: Geographic Information Systems (GIS), mapping and spatial data
- E.1 Geographic information in HERs: maps and GIS
- E.1.1 Mapping
- E.1.2 Mapping issues
- E.1.3 GIS and spatial databases
- E.1.4 Having a GIS strategy
- E.2 GIS and spatial databases
- E.2.1 Modelling and documenting spatial data
- Layers (themes)
- Vector and raster data
- Attribute, spatial and topological components
- Georeferencing, projections and datums
- Coordinate systems in the UK
- OS National Grid
- E.2.2 Systems to work with spatial data (GIS)
- GIS software
- Procuring GIS software
- E.2.3 Sources of spatial data
- Spatial data from paper mapping
- Commercial mapping
- OS MasterMap®
- OS Positional Accuracy Improvement (PAI) Programme
- E.2.4 Precision and accuracy
- E.2.5 Useful websites and references
- Books and edited volumes
- Websites
- E.3 Using GIS in an HER
- E.3.1 Uses of GIS and spatial data
- E.3.2 Linking GIS to text databases
- E.3.3 Developing HER layers in the GIS
- E.3.4 Mapping features on the GIS
- Depiction of the extent of known boundaries
- Conventions for depicting uncertain boundaries
- Creating a GIS layer to show legally defined boundaries
- Scale of mapping against which data is captured or displayed
- Capturing archaeological and architectural boundaries
- Accuracy of grid references for archaeological point data
- E.3.5 A sample heritage GIS
- E.4 Spatial data standards and documentation
- E.4.1 National and international spatial standards
- Standards for geographic data
- Spatial metadata standards in the UK
- GiGateway and the National Geospatial Data Framework (NGDF)
- The Intra-governmental Group on Geographic Information (IGGI)
- E.4.2 Sharing spatial data
- Intranets
- Internet and map serving
- E.4.3 Useful websites and references
- E.5 Historic Landscape Characterisation
- E.5.1 Introduction to HLC
- E.5.2 Background
- Websites:
- E.5.3 Development of HLC
- E.5.4 Methodology
- Historic Landscape Character or Historic Land-use Assessment (HLA): Uniformity of principle
- England
- Scotland
- Wales
- Sources
- Developments in Methodology
- E.5.5 Issues relating to how HLC may complement the HER
- Rationalising the HER and HLC data
- HLC in parallel or imbedded into HER
- HLC integrated into HER
- E.5.6 Data maintenance and update
- E.5.7 Applications for HLC
- Panel 10: Potential Modelling for HLC
- E.5.8 Case studies
- Suffolk
- Scotland
- South East England
- E.5.9 Future Developments
- E.5.10 Useful web sites
- E.5.11 Solving the ‘HLA in Planning’ Problem: Aberdeenshire case study
HERs comprise both textual records of historical and archaeological sites (or events), and also a map based record of their locations. Historically, in paper-based HERs, the textual (attribute) record was stored on a card index or record sheet, while the locations (geographic information) were marked on a series of related maps. HERs in England usually hold paper maps showing the location of archaeological sites but while computerised databases have now largely replaced card indexes for handling attribute data, it has not been until relatively recently that Geographic Information Systems (GIS) have begun to replicate and enhance the geographic component of HER data.
E.1 Geographic information in HERs: maps and GIS#
E.1.1 Mapping#
The way in which archaeological sites have been mapped varies, but two main types of mapping can be found, with some HERs maintaining both types (Baker 1999a):- Archaeological constraint areas: this type of mapping attempts to show areas within which archaeological remains are known and/or suspected to survive. This helps archaeologists, planners, developers and others to see rapidly whether a particular development is likely to require an archaeological response. This may also mean that the areas outside the constraint line might be considered to be devoid of archaeological interest and some HERs have, for this reason, decided not to define areas of constraint.
- Archaeological extent: in this type of mapping, the areas indicated are the extents of known archaeological monuments. Where this extent is only approximately known then it is normal practice for a line to be defined around the nearest field boundary. It is usual for linear features such as Roman roads to be delineated and also for find spots to be depicted by a spot or a circle. Where there is uncertainty as to whether the location is correct, a dashed line may be used to indicate this.
The scales used by HERs will vary but the basic mapping is usually 1:10,000 with more complex areas such as historic towns mapped at 1:2,500 or even 1:1,250. Some HERs have mapped directly on to paper or film copies of the OS maps, whereas others use overlays. The advantage of the latter approach is that the overlay is independent of the OS map base, which changes over time.
In practice, most HERs will have a variety of types of maps that have been developed for different purposes and projects. For example, crop-mark sites may be plotted on separate overlays, which can be placed over the main HER maps to enable the user to see the crop-mark features within each HER monument.
E.1.2 Mapping issues#
In HER mapping it is important to consider the following:- the HER recording manual and user guide should explain how sites have been mapped.
- a consistent approach should be taken to mapping, especially across each type of mapping.
- there should be consistent use of symbols, which should be defined in a key either on the map itself or in the HER recording guidelines or user guide.
Maps form a fundamental tool without which HERs would be unable to function. However, paper maps have their limitations. It can be difficult to keep the map base itself up-to-date. Maps can be time-consuming to use and can be viewed by only a few people at any one time. Only a limited amount of information can be shown on one set of maps or overlays, making it harder to carry out assessment and analysis. For these reasons, most HERs have adopted or are exploring the use of GIS.
E.1.3 GIS and spatial databases#
GIS has much to offer within local government, and is now established as the tool of choice not only for managing spatial information both within archaeological and heritage contexts, but also for all other areas that deal with spatial data including environmental management, planning, rights of way, flood management and many other topics.As a result, many local authorities have or are establishing corporate GIS-based databases helping to avoid duplication of effort, make best use of resources and bring together datasets which were becoming fragmented. Linking an HER dataset into a corporate GIS means that the HER data can be displayed and related to other datasets held in the authority. These may be topographical, such as contours and rivers, or other planning constraints such as conservation areas and SSSIs. This opens up new possibilities for taking a more integrated approach to planning and conservation.
GIS also opens up avenues for analysis and research into the historic environment. As desktop GIS software develops and its power continues to grow, there is increased potential for analysis and visualisation of datasets, for example in three dimensions or in virtual-reality models. Recent development of web browsers incorporating GIS is enhancing the potential for sharing and display of information through corporate intranets and the internet.
There are now many books on the uses of GIS in archaeology, including edited volumes illustrating the uses of GIS for research and management of projects (see for example Gillings et al 1999, Lock 2000, Westcott and Brandon 2000) and also more general sources (Wheatley and Gillings 2002, Connolly and Lake in press). The ADS's GIS Guide to Good Practice (Gillings and Wise 1998) provides practical guidance for individuals and organisations involved in the creation, maintenance, use and long-term preservation of GIS-based digital resources and also provides specific advice for HERs.
The aim of this section of the manual is to provide a primer on some of the issues to consider before embarking on system development. It does not set out to review general functionality of GIS in any detail or to review the current GIS market place. Rather, it sets out some of the considerations to be taken into account in establishing a GIS for an HER, and some of the benefits that can be gained through successful implementation.
E.1.4 Having a GIS strategy#
Desktop GIS applications are relatively affordable, and run on commonly available PC platforms. However, the overall systems cost to put together an HER application (including procurement, customisation, data capture, maintenance, mapping) remains high. Although elements of the system-development life cycle may sometimes be missed out, this will generally be a false economy. For example, omitting a clear and well-thought-out statement of user requirements will, at the minimum, make it difficult to measure whether the system has fulfilled its anticipated purposes, and at the worst, result in frustrated users and managers who feel 'let down'. The development of systems that will meet needs over the life of the system and that enable the information held within them to be transferred to future systems requires careful planning. Significant changes after system implementation can be very expensive.Many local authorities will have either departmental or corporate policies governing GIS. These may include standards for hardware and software, data standards and policies for access. GIS is well suited to a corporate approach to data management, since it can bring together information from different sources, and even different data types into a single, spatial view. For example, GIS allows users to select a location (for example a property address) and to display text information from a database of planning proposals, a listed buildings database, an HER database or other digital information such as a scanned property deed from the record office or photographs from the engineer's department.
As with most computing, the continuing emphasis on communications and IT in higher education ensures that there is a growing awareness of GIS amongst recent graduates. For existing HER staff, training in the corporate GIS is generally available either from the local authority or from commercial training providers. There are also courses offered by university continuing education departments and others on the use of GIS in archaeology and for conservation.
E.2 GIS and spatial databases#
Geographic Information Systems are conventionally defined as systems that capture, store, manipulate and output geographical information. Geographical information may be considered as information that is tied into some specific set of locations on the earth's surface, including those immediately adjacent: the sub-surface, oceans and atmosphere. 'Spatial' is now starting to become a commonly used term or synonym for 'geographical'. The term 'geospatial' is gaining currency and also describes the trend towards convergence of spatial technologies such as Global Positioning Systems (GPS), aerial and remote sensing and context-aware computing.GIS emerged from three principal roots: the need for data analysis and display tools, the automation of map production, and landscape architecture and environmentally sensitive planning. Although GIS have been available since the 1960s, it is only in recent years that hardware and software have become sufficiently powerful and inexpensive for its use to become widespread.
E.2.1 Modelling and documenting spatial data#
Layers (themes)#
Spatial databases are structured into thematic layers. This means that the system stores geographic data according to the real-world theme to which it relates. A typical spatial database may have separate layers (themes) to represent:- Topographic height (for example a digital elevation model)
- Soil type
- Rivers and streams
- Roads
- Archaeological monuments
Vector and raster data#
There are two main types of data used in GIS layers: vector and raster, which differ principally in how the system represents the geographic component of the data in a computer file. In a vector representation, the spatial database contains a geometric description of the theme in question, while in a raster representation regularly spaced samples of something are stored.Vector data is therefore similar to data in a CAD package. Each element in the layer is represented by some geometric entity such as a point, line, or polygon. The process of creating vector data is similar to drawing, using either a digitising tablet or by drawing objects on the computer screen and can be time consuming and expensive. This has the advantages of providing a compact data-storage format, allowing scalable presentation. Being based on geometric objects, it is straightforward to link these to text-based records. Vector representation permits easy quantification of areas and some analytical methods such as network analysis. Ordnance Survey Landline mapping captured at base scales of 1:1,250, 1:2,500 and 1:10,000 for urban, rural and upland/moorland areas respectively, is an example of vector data (in this case containing many different layers). Increasingly though OS Landline mapping is being replaced by the topography layer of OS MasterMap®.
Raster layers are more similar to digital images, as they are made up of a grid of cells, each of which contains a value at a particular location. Raster data is usually generated automatically by scanning paper originals, or obtained from digital sensors (in cameras, or satellites) and is therefore often rapid and cheap to generate. However the quality of the raster dataset is dependant on both the resolution the image is captured at and on the qualtiy of the locational data fixing the position of the image within the GIS. This is particularly suitable for applications requiring display of fine detail (for example aerial photography or historical mapping) but also facilitates many forms of terrain analysis and simulation modelling. Raster data may be dichotomous (that is, cell values are either 1 or 0, to provide a black and white picture) or continuous, where each cell may be assigned a range of values. Examples of widely-used raster data sources include the OS Siteplan® data (for scales between 1:500 and 1:2,500) and Ordnance Survey 1:10,000 and 1:25,000 scale raster products. Raster data is almost always supplied in pre-defined areal units or 'tiles' based on the OS National Grid.
Typical vector applications include spatially referenced database applications – for example, location maps, sites, monuments, artefacts – mapping applications, managing networks (such as roads and utilities) and terrain analysis using TIN elevation models. Raster themes are often employed to analyse continuously varying layers such as slope, elevation or resistivity and remote-sensed data such as satellite imagery. Analyses that employ raster data typically include neighbourhood analysis and overlay operations (for example reclassifying two separate maps of land use and height to obtain an intersected model of land use at height), simulation modelling, predictive modelling, decision support, cost surface and optimum route analysis and visibility analysis.
Many themes could be represented by either vector or raster data models. Terrain, for example, can be represented either by a vector model, using a network of triangles (referred to as a Triangulated Irregular Network or TIN), or by a raster altitude matrix in which each cell contains the elevation at that location. The choice of representation depends on a range of factors, including the capabilities of the software, availability of source data and the intended uses of the data.
Fortunately, most major GIS now work with both types of information, and can use them effectively together. Many forms of analysis (such as visibility analysis or hydrological modelling) can be undertaken using either raster or vector layers, and the two can also be employed together as, for example, when a satellite image is 'draped' over a vector terrain model, creating a 'digital landscape' which a user can explore (rather like a virtual reality 'fly through' (see Figure 39)). It is also possible to automatically convert data from vector to raster and – with some limitations – from raster to vector when needed.
 |
It is important to note that users of third-party data should be aware of how the data was created, if good control of spatial accuracy is to be obtained. Ideally, spatial data should be supplied with metadata that records how and when the data was captured, and how it was georeferenced to the National Grid. This is particularly relevant with third-party surveys, where it is vital to fully record and understand the precision and accuracy of the survey and the methods used to georeference it. The widespread use of Global Positioning Systems (GPS) to undertake new surveys has recently made this even more pertinent (see below).
Attribute, spatial and topological components#
The choice of vector or raster representation is not the only factor in the design of a spatial database. A fully geographic database will consist of three separate information aspects: attribute, spatial and topological components.- The attribute component refers to the non-geographic content of the data. In an archaeological context, this will include any observations about interventions, condition, sources and so forth that are stored in a conventional database.
- The spatial component refers to the location of the site or event in geographical space. Not all attributes may have a geographical component, and where they do this may be represented by either vector or raster models.
- Spatial data, however, also requires a topological component in order to fully describe the connections between geographic entities. This contains, for example, the intersections between lines of a network (such as rivers) and the geometric relationships between polygons in a vector theme.
Most large GIS systems will provide mechanisms to store and manage all three of these either 'in-house' or by allowing links to be made with external data sources, as where a polygon on a GIS layer is linked to an event record in a conventional database.
Georeferencing, projections and datums#
The term 'georeferenced' describes data whose position in geographical space is fully recorded, usually in the form of standard cartographic grid references. The process of fully recording the geographic location of a data theme is usually called georeferencing the data, and is one of the most important stages in the creation of a geographic database.Georeferencing usually comprises two steps. Initially, the data will be digitised in whichever system of coordinates is used in the original map. For vector data, this will involve calibrating the digitising device to the coordinate system on the map (it is also important to try to estimate and record the level of precision to which the map is digitised, as this contributes to the accuracy of the produced data). For scanned data, the initial stage of georeferencing involves at a minimum locating the corners of the raster grid in geographic coordinate space. In many cases, such as aerial photographs, this is not sufficient to accurately georeference all the raster cells in the theme and it is necessary to set up a more complex coordinate transformation between the raster and the coordinate system, usually by identifying control points on the raster and entering their known coordinate positions. In the UK the coordinate system used for georeferencing is usually the OS National Grid (more properlly called OSGB36, see below) and if all data is recorded within this sytem, it may not be necessary to delve further into the complexities of georeferencing.
To integrate OSGB36 data themes with sources of data referenced to other coordinate systems, however, it is necessary for the spatial database to also have a full description of both coordinate systems. This is required, for example, for the integration of digitised map data with independently recorded GPS readings. In this case, features on the map will 'know' their OS National Grid locations, but the GPS readings may be in a different GPS coordinate system (for example WGS84). Unless the spatial database contains information about how each of these coordinate systems relate to a common reference system, it will not be possible to visualise or analyse these two data themes together. This usually involves recording at least the projection and the horizontal datum of the coordinate system that is used. This should be printed on the maps, or can be found in publications of the agency who defined or maintain the coordinate system.
It is usually this second part of georeferencing which leads to confusion, although fortunately many contemporary GIS are now supplied with a wide range of pre-configured coordinate systems, projections and datums which can make things much easier. In order to fully understand georeferencing, however, it is advisable to have some basic understanding of geodesy: the study of the shape of the earth and the determination of the exact position of geographical points. This is increasingly important because of the growth of surveys undertaken with GPS receivers and is particularly problematic when it comes to integrating data about topographic height.
Coordinate systems in the UK#
The traditional coordinate system, on which most of the UKs mapping is based, is usually called the National Grid. More fully, it is the Ordnance Survey of Great Britain 1936 (OSGB36) and has historically been defined by a a national network of triangulation pillars. It is based on a Transverse Mercator projection, made about the 2 degree west meridian, with the crossing point of this and the 49 north parallel defining a false origin of 400,000 N, 100,000 E. Height values may be based on one of several vertical datums around the UK, but for mainland Britain they relate to the mean sea level at Newlyn in Cornwall (or, more properly, on observations of those made between 1915 and 1921).The widespread availability of accurate, globally-reference survey coordinates has recently rendered traditional triangulation networks effectively obsolete, and the National Grid is no longer defined in those terms. Ordnance Survey have therefore established a new national positioning infrastructure based on the European Terrestrial Reference framework (ETRS89). This is maintained by a group of permanently installed GPS receivers around Great Britain, referred to as Active Stations. These coordinates are now used to define OSGB36 through specifying how to convert between ETRS89 coordinates and OSGB36. The OS provides transformations for both plan position (National Grid Transformation, or OSTN02) and for height values (National Geoid Model, the OSGM02).
Collecting accurate GPS data in the UK that can be accurately positioned on existing data usually now involves (i) establishing the receiver's position in the ETRS89 system and then (ii) converting those surveyed coordinates using OSNT02 and OSGM02 to their equivalent OSGB36 coordinates. These stages may be undertaken either at the time of survey or later, and may be done within the GPS receiver itself, or in post-processing software.
Older or simpler GPS data may provide coordinate values in the World Geodetic System (WGS84). This differs from ETRS89 in that WGS84 is not tied to any point on the earth's surface. As such, it can be problematic to accurately convert coordinates in WGS84 and similar global systems to map coordinates because the surface of the earth is not stationary (plate tectonics can move two positions on the earth's surface by as much as 2cm in one year).
An excellent introduction to the issues arising from use of GPS-derived coordinates, from an archaeological perspective, can be found in Ainsworth and Thomason (2003).
OS National Grid#
The OS National Grid is one of several possible means of describing a position in space, although it is probably the most widely used referencing system in archaeology. The National Grid for Great Britain is a descriptive grid drawn from a single false origin (lying to the south-west of the Isles of Scilly) that allows for points to be referenced to a notional sub-metre accuracy. Conventionally map sheet letters preface points on the grid, for example SK 12345678, where the map sheet represents a 100-kilometre square (SK).The National Grid also allows for absolute references expressed in a fully numeric format. For example the reference 345678987654 refers to a location 345678m east 987654m north of the origin. This numerical format for references is convenient as most GIS packages do not recognise the letters associated with map sheets, using co-ordinate systems that depend entirely upon numeric fields.
Ideally, a location will be identified to the nearest metre within the National Grid. However, it is not uncommon to use less precise references – to the nearest 10 or 100m – by omitting the least significant digits. For example, a reference with only six figures after the letter code (for example SK123568) or with only 10 digits (3456898765) refers to a location with a 10m precision, while SK1257 or 34579877 have 100m precision. Clearly it is vital to treat locations supplied with 10 or 100m precision references with care: they frequently need to be interpreted to mean 'the location is somewhere in the square whose origin is specified by the grid reference' as opposed to “the location is within 10 or 100m of the reference”. For this reason both the original (source) formats of coordinates should be stored in HERs, as well as any 'GIS friendly' derived coordinate values (see also section E.2.4).
Note that, although most absolute grid references will be expressed in twelve figures, all sites locations in OS 100km map squares commencing with H (All of Shetland and much of Orkney) will have seven figure northings whilst the following map squares (NA, NF and NL (all covering the Western Isles) and SV covering the Isles of Scilly, have only five figure eastings.
An online tutorial on the National Grid can be found in the education section of the OS website http://www.ordnancesurvey.co.uk/oswebsite/gi/nationalgrid/nghelp1.html
E.2.2 Systems to work with spatial data (GIS)#
GIS software#
There is a trend towards GIS becoming easier to use (for example through familiar Windows-type Graphical User Interfaces or GUIs), with a diversification in the market place to distinguish between the needs of 'heavyweight' applications, and day-to-day data analysis and visualisation (sometimes characterised as 'doers', 'users' and 'viewers'). Modern desktop GIS applications software (such as Maplnfo®, ArcView®, ArcGIS®, GeoMedia®) are powerful programs in their own right, however related software products (ER Mapper, ERDAS® Imagine) combine sophisticated tools for image-processing techniques, such as orthorectification and mosaicing aerial photographs, with some GIS functionality and can be used to prepare raster layers prior to importing them into a GIS. GIS functions are also being incorporated into a number of other software products ranging from AutoCAD® – where a fully-functioning GIS has been built 'on top' of the CAD system – down to the provision of basic mapping functions in Microsoft® Excel®.Procuring GIS software#
If a local authority has chosen a particular GIS, this may be a powerful argument for the HER to do likewise. A corporate GIS will make the task of sharing data with other sections easier and will enable the HER to harness the expertise within the authority, helping to support the system, and possibly to obtain the software at low or no cost. HER managers should still check that this software meets their requirements. These requirements must be realistic - think about how much a facility would be used, and if the requirement is occasional, whether there are cheaper ways of meeting the need, such as using an external contractor.One element of the user requirement is likely to be a list of the functions that the GIS is intended to perform. A useful source of advice is the Functional Requirement Specification for GIS (LGMB 1991), available from the Improvement and Development Agency, formerly the Local Government Management Board (LGMB). This includes a catalogue of GIS functions, which can be used as a 'checklist' to compare different software products and to assess if any customisation might be required and what skills would be needed to achieve the desired outcome. Target response times for operations that are important to users can provide a useful benchmark and can be used to make sure that the users' expectations and the developer's system performance targets are aligned. For example, if the identification of all records falling within an administrative boundary will be a frequent enquiry what would be the maximum acceptable time for this to take?
E.2.3 Sources of spatial data#
Spatial data from paper mapping#
Where paper mapping exists and there is a need to generate GIS themes from it, then there are essentially two choices: scanning (which produces raster data) and digitising (which produces vector data). The choice of these will partly be constrained by cost – it is far cheaper to scan than to digitise – but this needs to be balanced against issues of storage and usefulness. As a generalisation, scanned data is useful for visualisation and for making maps, and is increasingly useful as a preliminary step in digitising (see 'heads up digitising' below). Vector data, on the other hand, is far more flexible where analytical use is foreseen or where output mapping needs to have different components of the input data.Scanning can be undertaken in-house, although scanners large enough to process whole maps are expensive (approximately £3,000 - £15,000 depending on features) and time consuming to set up and use. More commonly, the scanning of a document archive will be placed in the hands of an outside agency and it is therefore vital that a clear job specification is established in advance. This should cover the resolution of the scans, whether they will be monochrome, greyscale or colour, the file format and compression to be used and should also make clear what quality checks will be undertaken and whether the job includes user-intervention to clean the data after scanning. Agencies will probably supply scanned data on CD-ROM or DVD-ROM and it is advisable to make archive copies of these original materials quickly and store these under archive conditions.
Digitising paper sources is far more time consuming, as it involves attaching the map to a digitising tablet and tracing over the different data elements to, effectively, 'draw' the require data manually. To some extent, digitising in this way has been overtaken by the use of 'heads up digitising' (see below) and by automated raster-to-vector tools but it remains true that the creation of accurate, well-structured, topologically correct vector data requires considerable level of human intervention and is an order of magnitude more time consuming (and hence expensive) than scanning. The pay-off for this effort, however, is that the resulting data is a great deal more structured and useful for analytical purposes than any raster product. As with scanning, it is possible to undertake digitising 'in-house' using digitising tablets. These are available in sizes from A5 up to A0 although larger tablets are expensive to purchase and difficult to support. The vast majority of HERs are unlikely to be able to justify purchase of this kind of equipment unless it is as part of a wider institutional project supporting other areas as well as archaeology. As such, digitisation projects are likely to be undertaken by outside contractors as with scanning and it is even more vital that a thorough agreement is made in advance covering the accuracy, precision, quality and format of supplied data.
'Heads up' digitising refers to the two-stage process whereby maps are initially scanned, and then vector data is traced from the scans using the computer screen rather than the digitiser. Increases in computer power and screen resolutions in recent years have made this an attractive method of digitising data, which can often be undertaken by users themselves on an 'as needed' basis (although it is difficult to establish good quality standards in this way). This also makes it more attractive for HERs to scan paper archives because, if collected with the possibility of heads-up digitising in mind, then this is now an open-ended strategy that does not preclude generation of vectors in the future.
Moving between vector and raster data is possible in both directions, although it is important to understand the limitations of this. It is relatively straightforward to generate raster data themes from vector data (for display or for analysis in raster-based GIS) and most commercial GIS will provide functions for this. Generating vector data from raster (scanned) themes is, however, far more difficult as the computer needs to make 'intelligent' choices about how the pixels in the raster relate to geometric entities (lines, areas and so forth) in a vector theme. Nevertheless, software is available which will take scanned maps, such as contour maps, and generate vector outputs in the same way that Optical Character Recognition (OCR) software can generate text from scanned documents. These can be a valuable first step in generating vector data, reducing some of the tedious line-following procedures, but (as with OCR software) it is important to realise that none of these are foolproof, and that automatically generated vector themes will still require considerable user intervention to produce topologically-complete, clean vector data. There is a strong argument for HERs to refrain from becoming involved in decisions about how vector data is generated, but rather to concentrate on setting down the specification (in terms of quality, accuracy, precision and so forth) of the data that is required, and then leaving it to agencies to decide if that is best delivered by full automation, partial automation or human intervention.
Commercial mapping#
One of the principal sources of commercial mapping in the UK is the OS, which now provides a wide range of mapping and other spatial data in digital formats. These may be available to HER maintainers as part of wider corporate licensing arrangements. All OS data is subject to Crown Copyright and arrangements will exist in most organisations for appropriate copyright statements to be included with any maps or output that uses OS data.Ordnance Survey provide both raster products and also vector data sets. Raster products are essentially scanned versions of OS maps available at a variety of scales and useful as backdrops for creating, for example, constraint maps. Raster data is available at 1:250,000, 1:50,000 and 1:25,000 scales for different mapping purposes.
Ordance Survey vector datasets are also available at a variety of spatial scales, and with a wide variety of thematic information. Among the more useful of these are the Landform PROFILE® dataset, which represents contours derived from 1:10,000 scale mapping and the LandLine® dataset which contains layers representing a wide range of manmade environment including houses, factories, roads, and administrative boundaries as well as heritage features. LandLine® data is scaled according to the region with 1:1,250 scale data for urban areas; 1:2,500 scale in rural areas; and 1:10,000 scale for remote areas such as mountains and moorland.
The Ordnance Survey's digital datasets (particularly LandLine) are currently being replaced with a new delivery mechanism for GIS data called OS MasterMap® (see below).
Other commercial digital map sources area available, although none can compete for completeness or up-to-date survey with the Ordnance Survey. However, for some tasks where OS data is not available, it may be possible to turn to providers such as Bartholemews (http://www.bartholomewmaps.com/) for particular digital map data supplies.
One of the most widely used sources for digital data is aerial photography, which may be held by larger HER maintainers in the form of negatives or prints. These can be scanned and georectified to provide not only data relating to crop and soil mark sites, but also additional map detail that may not be available in commercial mapping. Aerial photographic coverage can also be purchased commercially or licensed from the Ordnance Survey or from a range of commercial resellers such as Getmapping® (http://www.getmapping.co.uk/).
OS MasterMap®#
OS MasterMap® is an intelligent digital map designed by the OS for use with geographical information systems (GIS) and databases. It provides significant advantages to users of digital data, including seamless delivery, the use of a new coding system and improved metadata about spatial entities. However, it requires significant investment in new software in order to use it.OS MasterMap® comprises topography, imagery, address and ITN (integrated transport network) layers. Based on the National Grid, the topographic layer contains information on every landscape feature – including buildings, roads, archaeological features - and represents a significant evolution from traditional cartography. MasterMap® depicts the real-world digitally and presents this information as themes in a series of layers, each layer carrying millions of features. Each feature has its own unique identifier or TOID® - a 16-digit reference number that can be shared with other users across different applications and systems. This allows easier data association and greater accuracy, focusing on real-world objects on the map. In addition, the Ordnance Survey have released a high quality Imagery Layer whose images have been fully orthorectified to represent truly and accurately what is on the ground. The Imagery Layer is available at 25 cm resolution and 24 bit colour. The Address Layer of OS MasterMap® provides precise coordinates for more than 26 million residential and commercial properties in Great Britain, whilst the ITN layer is probably of less use to the HER officer. It enables business needs from navigation to asset management and from traffic analysis to accessibility studies.
Users of MasterMap® data should also be aware that, in addition to the data format itself, the delivery of data with improved positional accuracy (see Positional Accuracy Improvement programme below) differs between MasterMap® and older formats and digital products such as Landline®, Profile® and Panorama®.
Further details can be obtained from the OS website ]http://www.ordnancesurvey.co.uk/oswebsite/products/osmastermap/].
OS Positional Accuracy Improvement (PAI) Programme#
Since April 2001, the Ordnance Survey have been undertaking a Positional Accuracy Improvement (PAI) programme of the 1:2,500 small town and rural map base throughout Great Britain. PAI captures data to a greater absolute accuracy in relation to the National Grid, resulting in improved and more consistent data. It is claimed that PAI will also future-proof the data for the addition of new feature detail as well as providing a better relationship between the OS 1:2,500 map data and information captured through GPS.In simple terms, data that has been through PAI will have better absolute and relative accuracy than previously supplied data, but at the expense that it may no longer match existing (legacy) data products. Where HERs contain data that has been created by reference to OS data products, there is now a possibility that this data will appear to be in error because the underlying OS mapping has 'moved' slightly. This movement should not be excessive, but may in some cases result in changes of up to a few metres.
It would therefore represent good practice for HER officers to undertake an audit of the data they are responsible for maintaining to assess how that data was originally created. The spatial elements of most databases were created against 1:10,000 paper maps with grid references expressed to the nearest 6 or 8 figures (that is to nearest 100m or 10m) and should not be affected by PAI. However, if the boundaries of an HER record are, for example, delineated along the representation of field boundaries on a 1:2,500 tile, then the shape of that land parcel may be altered through the transformation processes resulting in errors in the HER data. Those errors may include spatial (position) errors, but may also potentially result in topological errors (such as 'slivers' and 'gaps') where data is processed against new OS datasets.
Where migration to post-PAI Ordnance Survey data is necessary, then a variety of assistance and tools are available from OS and from third-party GIS manufacturers to help update HER data to match OS mapping. These include 'link files' of coordinate corrections and processing tools which, in combination, can provide for automatic (or semi-automatic) updating of spatial data themes according to the known changes in spatial position.
Ordnance Survey have produced a series of documents including a “PAI Companion” that explains the workings and implications of the PAI in more detail. This can be downloaded in PDF format from the OS website, which also contains the most up-to-date information about the progress of PAI (see http://www.ordnancesurvey.co.uk/oswebsite/pai/).
E.2.4 Precision and accuracy#
Precision and accuracy are important issues in GIS. Precision is the degree to which a measurement is refined while accuracy records the correctness with which the measurement is taken (Richards and Ryan 1985). Thus a six-figure grid reference may be accurate but imprecise while a twelve-figure grid reference may be precise but inaccurate.Precision and accuracy become significant when comparing disparate datasets is made possible with GIS. These sorts of issues come to the fore in GIS because vector displays can give a spurious impression of highly precise and accurate mapping. Scale, the ratio between distances on the map and in real space, can be manipulated almost infinitely in a vector GIS, as areas are 'zoomed' or 'panned' to suit. However, simply because it is possible to zoom does not mean that the data thus displayed will be accurate at the new scale. OS contour data, for example, may be digitised from 1:50,000 map sheets, at which scale the smallest distance that can be distinguished is 0.5mm or 5m on the ground. Because this data can be reproduced in the GIS at 1:10,000, at a resolution one fifth of the original, it does not become more accurate. Thus a point captured on screen against a 1:50,000 map base will be accurate at that scale and not progressively more accurate to any larger scale to which the map has been zoomed.
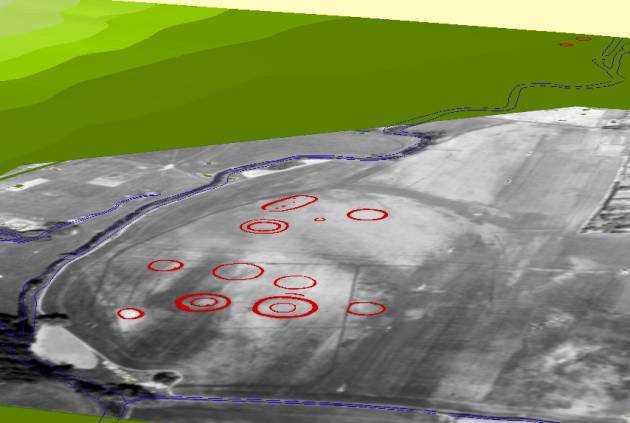
There are two approaches to representing the precision with which heritage objects are located within the GIS. The first approach (Figure 40), adopted by the former Archaeology Division of the OS, places the object in the bottom south-west corner of a virtual square somewhere in which the object is located. For example, an object recorded as a four-figure reference (such as TQ 77 89) could lie anywhere within that 1 kilometre square. Similarly, a six-figure reference (such as TQ 724 876) could lie anywhere within a 100 metre square. In both cases, the object would be represented as a point marked on a map in the south-west corner of the appropriate square, that is, the point marking TQ 77 89 would be marked at TQ 7700 8900. Variations in this approach include placing the point in the centre of a square rather than the south-west corner, (that is, the point marking TQ 77 89 would be marked at TQ 7750 8950) or in the centre of a virtual circle.
 |
This approach has the advantage that, since most four-figure references are for stray finds, representation as a point bears some relation to the object depicted. The approach has the disadvantage that the object will only be retrieved by a spatial search that includes the point (whether located in the south-west corner or centre) although the implied imprecision means that the object could derive from a wider area.
The second approach (Figure 41) attempts to overcome the spatial retrieval problem by representing the object as the 'physical space' within which the object might lie, so that a square or a circle is depicted in the GIS. These would normally be transparent (that is, only the outline of the object would be visible) to avoid obscuring other heritage objects lying 'beneath'. In this way, the known boundaries of monuments and buildings would be visible at the same time as the fuzzy boundary represented for a stray find or other imprecisely located heritage object.
 |
If 'area' features are also depicted as circular boundaries of approximate diameter (for example an artefact scatter) it is also worth adopting different conventions for the symbols used, such as a broken line, or a semi-transparent fill.
Whichever approach is adopted, recording the actual precision of the object is essential. Both methods will incur the problem of 'stacked' objects, where more than one object has been located in the same space. This is a common GIS problem, not confined to archaeological representation, it also occurs, for example, when representing the individual property units in a block of flats in two dimensions. Many GIS systems are able to indicate a stack of objects when the cursor is hovered over the objects or the stack is selected. However, a plot will give the appearance of a single object at the location, unless ID numbers are included in the plot and these may also 'overprint'. A possible approach to solve this might be to offset each of the objects slightly, so that they will be visually distinguishable.
E.2.5 Useful websites and references#
Books and edited volumes#
Ainsworth, S. and Thomason, B. 2003 Where on Earth Are We?: The Global Positioning System (GPS) in archaeological Field Survey English Heitage Technical Paper (EH Product Code 50788).
Connolly, J. and Lake, M. 2006 Geographical Information Systems in Archaeology, Cambridge: Cambridge University Press (ISBN 0521797446)
Gillings, M., Mattingly, D. and van Dalen, J .(eds) 1999 Geographical Information Systems and Landscape Archaeology. The Archaeology of Mediterranean Landscapes 3. Oxford: Oxbow Books.(ISBN 1900188643)
Lock, G. (ed) 2000 Beyond the Map: Archaeology and spatial technologies. Nato Science Series, Series A: Life Sciences – Vol. 321. Oxford: IOS Press. (ISSN 1387-6686)
Richards, J.D. and Ryan, N.S. 1985 Data Processing in Archaeology. Cambridge: Cambridge University Press (ISBN 0521257697)
Westcott, K.L. and Brandon, R.J. 2000 Practical Applications of GIS for Archaeologists: a Predictive Modeling Kit. Philadelphia PA: Taylor and Francis. (ISBN 0748408304)
Wheatley, D. and Gillings, M. 2002 Spatial Technology and Archaeology: the Archaeological Applications of GIS. London: Taylor and Francis (ISBN 0415246393)
Websites#
ADS GIS Guide to Good Practice: http://guides.archaeologydataservice.ac.uk/g2gp/Gis_Toc
Australian and New Zealand Land Information Council: http://www.anzlic.org.au/
Bartholemews maps: http://www.bartholomewmaps.com/
Getmapping® (digital data reseller): http://www.getmapping.co.uk/
Ordnance Survey:
- Main website: http://www.ordnancesurvey.co.uk/
- National Grid tutorial: http://www.ordnancesurvey.co.uk/oswebsite/gi/nationalgrid/nghelp1.html
- Mastermap: http://www.ordnancesurvey.co.uk/oswebsite/products/osmastermap/
- PAI programme: http://www.ordnancesurvey.co.uk/oswebsite/pai/
E.3 Using GIS in an HER#
E.3.1 Uses of GIS and spatial data#
The growing popularity of GIS amongst HERs is understandable, because they are so useful for many everyday tasks (Figure 42). These include: |
- Visualisation of data as spatial distributions (in either two or three dimensions): even a simple distribution (for example Iron Age settlements in Derbyshire) can provide a powerful aid to understanding or providing new insights into data. The ability to view a combination of datasets enhances this potential considerably (for example Neolithic settlements in relation to water courses, soils and contours).
- Analysing spatial relationships between data: for example finding all records of upstanding earthworks which lie on arable land. This enables interaction with data and helps to answer research questions (such as were the location of Bronze Age settlements influenced by proximity to, for example, natural resources, soils and water) .
- Improved decision-making: for example facilities to help identify sites that may be affected by a planning proposal by using 'buffer zones' - zones of fixed distance around a selected feature generated by the GIS.
- Overcoming the limitations of paper maps: for example editing, availability, currency, fragility, distortion, storage.
- Data integration: if a database is georeferenced, then a number of separate databases can be brought together in a common environment and viewed together.
- Improving data quality: through capturing geographic references directly; automating transfer of information (for example between GIS and text database); routines that check data integrity (for example point in polygon analysis to determine whether a grid reference falls within its assigned administrative boundaries).
- Saving time: through rapid availability of a wide range of sources of information. This is particularly true where wider institutional systems are available enabling access to non-archeological data sources as well as conventional HER data.
E.3.2 Linking GIS to text databases#
Most HERs using GIS will also hold spatial data and other information in the HER databases described in this manual. An important consideration in setting up the GIS will be how to create a link to the HER database (Figure 43). The first step in this process might be to export data from the HER database and use it to create points in the GIS (see B.8.4). However, this layer will become out of date as new records are added to the HER and HER managers will also wish to use the GIS to check and correct the locations of existing records in the HER database. |
Various approaches to the problem of keeping the two systems in step can be adopted:
- If the GIS is implemented as a separate system from the HER database then it may be periodically 'refreshed' with new data from the HER database. Any corrections that are made to site locations in the GIS will need to be exported (or manually copied) back to the text database.
- A dynamic link may be created between the HER database and the GIS using a communications protocol to enable grid co-ordinates and other information to be exchanged between the two systems.
- An approach that is not recommended for HERs would be to migrate all the existing HER data into the GIS and to scrap the existing text database. This is because few GIS products support complex data structures directly or offer the same flexibility in indexing or retrieval of information that is recommended for HER text databases.
Windows-based desktop GIS systems can be linked to external text databases using one of the following protocols: OLE (Object Linking and Embedding), DDE (Dynamic Data Exchange) or ODBC (Open Database Connectivity):
- OLE is a protocol and set of function calls that are incorporated into the Windows operating system. It allows programs to communicate with each other and is used extensively by Microsoft® to enable word processor, presentation, spreadsheet, database and other applications such as GIS to work together efficiently and exchange data. OLE is used to link or embed objects creating a compound document which can contain other documents: for example an Access form might contain a Word document, an Excel spreadsheet or a Maplnfo workspace. Linking means that data is presented in the compound document but it is retrieved from its original file using the file name. Embedding means that data from the original file is incorporated into the compound document.
- DDE is another protocol that is incorporated into the Windows operating system which allows one application to exchange data or to trigger an action in another application. DDE is a protocol for manipulating applications programmatically and allows data to be extracted, macros or programs to be run or information to be listed. There is some overlap in functionality with OLE but DDE is older, less robust and a more basic method of enabling communications between different applications. DDE is used for programs that do not support OLE, for example to create links between databases and ArcView GIS. DDE is also used for controlling programs across a network (a function not currently supported by OLE).
- ODBC is a common language definition and a set of protocols that allows a database application held on a client machine to interact with a different database application held on a server across a network. For example, using ODBC, an Access database held on a work station can query and exchange data with an Oracle database on a network server. For this to happen, ODBC drivers that are appropriate for the application software need to be installed on both the client machine and the server machine.
E.3.3 Developing HER layers in the GIS#
The way information has been modelled in the HER text databases will have a significant influence on the way the spatial information is constructed. The current data model may be based on MIDAS (Lee 1998) or derived from earlier monument-focused systems. Different attributes or data fields from the text database will be referenced in the GIS and used to create different layers or themes. A problem that will need to be accounted for is that data may not be entirely consistently recorded throughout the database: for example a monument-focused database may have contained some information about events and the HER may be in the process of implementing the event-monument-source data model. In developing HER layers in the GIS the following will need to be considered:- the initial data load from HER text database to GIS (see B.8.4)
- subsequent updates of the GIS layer (that is, with new records entered into the text database)
- subsequent updates of the text database (that is, with updates to grid references or new records imported from the GIS).
The ideal 'relationship' between text database and GIS is one in which data can be entered either through the GIS or through the text database, but this requires a close connection between the two systems. This is generally provided by a computer-generated record number (such as the HER number for monument records) which is used to link information held in data tables in the two systems. The HER text database will normally control the allocation of unique identifiers for monuments, events, sources and consultations. Users would go to the HER text database to create a new record and then, using an OLE or DDE link, go into the GIS to add or modify spatial data. With this type of link, core record details are copied from the text database into the GIS and spatial references are copied back from the GIS into the text database.
An even higher degree of integration between GIS and text database would allow users to start by creating a new record in the GIS. To achieve this the GIS needs to be able to activate the text database to generate the next unique identifier in the sequence.
When configuring the link between the GIS and the text database, users also need to consider what information will be passed between the two systems and specify appropriate rules for updating. Useful information to pass back from the GIS will include grid references, administrative boundaries and environmental features such as soils and geology. Useful information to pass from the text database will include monument type, period and building materials.
HER users also need to consider what information they wish to generate 'on the fly' in the GIS and what they wish to record directly in their text database. For example, a corporate GIS system may contain a large number of boundaries such as National Parks, Areas of Outstanding Natural Beauty (AONBs) and SSSIs Visual inspection of the GIS or a spatial query can readily identify which monuments lie within any of these boundaries without the information being directly attached to the monument records in the text database. HER managers are thus able to differentiate between important information about the monument status that they wish to appear on screen and in reports (for example scheduled status) and spatial queries that can be built up according to need in the GIS.
E.3.4 Mapping features on the GIS#
Mapped features representing the 'real world' are abstractions and symbols are used that can be readily understood or related to a key. For example, at a scale of 1:1 million, a city may be represented as a point - a completely abstract representation but one which is understandable and appropriate to the scale of mapping. Larger-scale maps generally use less abstract symbols, so for example at 1:10,000 the same city will be represented by the outlines of buildings, roads, gardens and so forth.In GIS, features can be represented using points, lines, polygons and 'poly-lines' (a continuous line consisting of multiple lines joined together). All of these have their uses in representing archaeological and historic features. For example, points could be used to represent find spots and also perhaps to indicate the location of features where these are already shown on the map, for example points within building outlines. Points are also useful for showing site locations in distribution maps at scales where polygons and polylines simply would not be visible. Lines can be used to indicate linear features such as roads, canals and railways.
In deciding which shape to use, it is important to consider to what purpose the data will be put. If, as in many cases it will be, the aim is to indicate the extent of a monument or building, then polygons will be most useful. If the purpose is to show discrete find spots then points are more appropriate. The next issue is how and where these shapes are to be drawn and the accuracy that is required; the scale of the apping available will affect the decision.
It is difficult to give detailed guidelines but the issues discussed below are worth taking into consideration.
Depiction of the extent of known boundaries#
Where the extent of the monument is known and especially where the monument or building is clearly visible, then there are advantages in showing the extent of the monument on the GIS. This enables users to see the monument or building in relation to other features in its landscape setting. Figure 44 shows an example of.the use of polygons to plot the early 19th century defences south of Chelmsford in relation to contours, thus allowing their topographical location to be understood. |
Conventions for depicting uncertain boundaries#
Where the extent is uncertain, then, as is often done with more conventional mapping, the boundary could be drawn using the nearest modern boundaries that enclose the known features (metadata should be recorded explaining why the polygon has been drawn in this way).Uncertainty can also be represented by symbols. For example, solid lines might be used to represent known boundaries, while uncertain boundaries could be represented by broken (dotted) lines. Some GIS may allow 'mixed' symbols within a polygon (for example where only one boundary is uncertain), though in most, a separate line would need to be digitised over that part of the polygon.
Creating a GIS layer to show legally defined boundaries#
Many sites recorded in HERs require special consideration in land-use planning, for example sites that are afforded statutory protection, which may have a legally defined boundary showing the protected area (Figure 45). The protected area may differ from the full extent of the monument site, such as a monument site that survives partially as earthworks and partially as cropmarks, with the better preserved portion of the site being scheduled. For these reasons, it is recommended practice to create separate layers within the GIS depicting the extents of protected sites, for example a Scheduled Monument (SM) layer would be created for scheduled monuments. These can then be displayed over other polygons that might show features or monuments both lying within and outside the protected area. It is recommended that HERs should, where possible, obtain digital boundaries from the organisation responsible for maintaining them, for example scheduled monuments from English Heritage. It has been recently agreed in Scotland that the RCAHMS displays site polygons as known extents, while the HERs/SMRs display site polygons with buffer zones. The extent of those buffer zones and so forth are still being discussed but agreement should be reached by end of 2006. |
Scale of mapping against which data is captured or displayed#
It is important to be aware of the implications of the scale of mapping against which heritage objects are captured or displayed. Map making is a process of reducing complexity and maps are drawn in a way that emphasises important features while suppressing unimportant ones. This is the 'selection and simplified representation of detail appropriate to the scale and/or the purpose of a map' (ICA 1973). Thus, if the width of a road on a 1:1,000,000 map were to be accurately measured, its representation would be considerably wider than the a real-world width of the road. As roads are important features on maps they need to be emphasised and, as a result, on the map any adjacent features are shifted.Because successively smaller scales of mapping are more generalised, an object whose position was captured against a small-scale map will, when displayed against a larger scale of map, appear to be in the wrong place (and vice versa). For example, the outline of a building captured against a 1:10,000 OS raster map will not be reliably displayed against 1:1,250 OS Landline because the digitised boundaries will not match the Landline boundaries. This effect is most marked when digitising from very small-scale mapping. For example, if Roman roads were digitised from a 1:1,000,000 map base, when displayed against a 1:10,000 map base, they might be up to 1 km away from their expected position. Thus, a dataset captured at small-scale is unsuitable for display against a detailed large-scale map.
Capturing archaeological and architectural boundaries#
As a general guide, 1:10,000 is the smallest scale of mapping against which the boundaries of archaeological monuments or features should be captured. For the outlines of detailed features, such as buildings, larger scale mapping such as 1:2,500 or 1:1,250 is preferable. Smaller scale mapping (for example 1:25,000 or 1:50,000) may be useful for capturing general area information (such as the bounding extent of a large field-walking survey).In each case, it is essential that the scale chosen is related to the purpose to which the information will be put. Details of the scale of map used in data capture should be documented in metadata.
Accuracy of grid references for archaeological point data#
In archaeology it is common practice to record the location of features using six or eight-figure grid references, for example TQ 367425. This convention presents real problems when translated into GIS because these co-ordinates represent the bottom left-hand (or south-west) corner of a square. A six-figure grid reference actually represents a 100 metre square, while an eight-figure grid reference represents a 10 metre square. The actual location of the archaeological feature lies somewhere within the square, at an imprecisely defined and perhaps uncertain point.If locations expressed as grid references are exported directly into a GIS and displayed as point data, the maps produced can be misleading. This is because the process of exporting the data can displace knowledge about the precision with which the grid references have been recorded.
For this reason 'padding' grid references with zeros added to the end of the numbers is a practice that can rarely be justified because, without supporting data, the process of exporting grid references from a text database into GIS can make it impossible to reconstruct whether the location of a find was generalised to the nearest major grid line, or fortuitously aligned with it.
HER managers can avoid the loss of this important information if the following measures are taken:
- ensuring that the HER text databases generally contain information relating to the site location, and recording both how the grid reference was derived and its precision. Points can be created in the HER's GIS based on grid references exported from monument records in HER text databases while retaining a link between the two systems. Data relating to the accuracy of the grid reference can be exported to the GIS alongside the grid references and used to select an appropriate symbol to depict the point.
- ensuring that metadata relating to the accuracy of the source of the locational information is recorded. If a site location is given to six or eight figures in a source but is depicted as a point accurate to 1m in the GIS, then the level of precision must be recorded in metadata.
E.3.5 A sample heritage GIS#
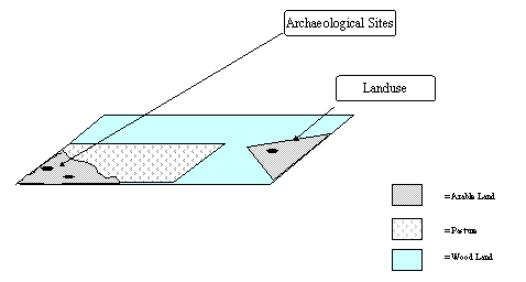
GIS systems are made up of 'layers' of information, which can be overlaid, combined and analysed to create new information. For example, the location of a number of archaeological sites could be compared to the location of aspects of the environment (Figure 46).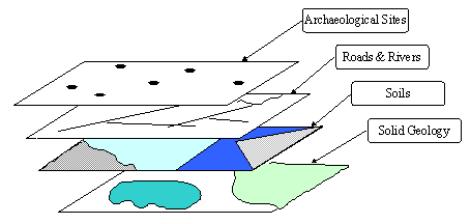 |
These can then be used to identify sites which lie within the boundaries of particular soil types, creating new information (very useful, for example, in identifying impacts of agri-environmental schemes, set-aside, and so forth) (Figure 47).
 |
E.4 Spatial data standards and documentation#
E.4.1 National and international spatial standards#
A number of national and international standards have been developed in the last few years to encourage consistent depiction of geographic space, and work is ongoing to discuss conventions for heritage datasets.Standards for geographic data#
Spatial data require recording standards concerning issues relating to accuracy, scale and resolution that do not normally arise in relation to other types of data. This section of the manual only summarises the issues, as more detailed guidance is available from a number of other sources, with various textbooks providing introductions to the problems that may arise. A useful starting point for HERs is the ADS's GIS Guide to Good Practice (Gillings and Wise 1998) and section E.3 of this manual gives guidelines on creating and managing layers in an archaeological GIS. The MIDAS mapped data Annexe addresses the specific needs of describing depiction of MIDAS inventory entries on maps, and the maps themselves, for example in a GIS (Geographic Information System), covering both individual features and layers.
Both in the initial capture of data and for subsequent maintenance and additions in the GIS, there are issues concerning standards which need to be considered if the spatial information is going to be usable. Because many of the outputs of GIS are visual, these pictures can be very persuasive. But GIS are only a model of the real world and the model can only be as good as the quality and appropriateness of the data within it. Data standards help users to control this and to be in a position to say whether data is 'fit for purpose'.
A number of different standards issues relate to spatial data and the following points should be considered:
- How will spatial data quality be controlled? Data quality can usefully be thought of as either compliance to a specification or the meeting of customer needs.
- What metadata or documentation should be recorded? Metadata might include information about a whole dataset (what it is, when it was captured, at what scale, against what base map product) or about individual items within it (who captured it, on what date and at what scale if variable).
- How will new data be captured? What are the standards for capturing information of different types? For example, a 1:10,000 base map may be appropriate for capturing point data, but will be less useful for capturing the outline of a building. An appropriate standard must be adopted for each case.
- What standards will be applied to the way data is displayed? What symbols will be used? How will uncertainties over the precision of location, fuzzy boundaries and so forth be represented?
- How will data be imported and exported from the system? Who are potential data suppliers and customers for digital data? What are their requirements and can they be met?
- How far should changes made to the data, or the source of the originals, be documented?
For each of these areas working practices need to be agreed and documented for use within the HER and related to standards in use within the organisation as a whole and to externally agreed data standards.
A number of national and international standards have been developed to encourage consistent depiction of geographic space and work is ongoing to discuss conventions for heritage datasets. A non-exclusive list of relevant standards and organisations that are concerned with spatial data standards would include the following:
- BS 7666_ specifies the manner in which address information should be specified, and is important within Local Government and the Utilities. Archaeologically, it may prove most useful in the consistent provision of address information, for example for Listed Buildings.
- FGDC_ the United States Federal Geographic Data Committee's Content Standard for Digital Geospatial Metadata is, perhaps, the best known and established of geospatial data standards, the current version having been first released in 1994, and updated in 1998. This standard underpins much of the US Federal Government's work with geospatial data, and is also used by other collectors of spatial data. The standard was recently enhanced, and is available in a variety of commonly used formats.
- ISO 15046_ is a draft standard from the International Standards Organisation Technical Committee TC/211 that addresses geographic information and geomatics. The draft standard appears modelled upon current FGDC practice, and offers powerful options for extensibility and modification within the wider standards framework.
- OGIS_ (Open Geodata Interoperability Specification) is an initiative by the vendor-led Open GIS Consortium (OGC). OGC is looking to increase the ease with which geospatial information may be passed between products, and OGIS is one important aspect of this work.
- The _National Geospatial Data Framework (NGDF)_ was an important co-operative initiative aiming to provide effective means of access to geospatial data that is collected and held by government and the public and private sectors. It will be replaced by the _GiGateway_ (see below).
Spatial metadata standards in the UK#
Fully describing spatial data is essential to using it, archiving it and deciding on how best to use it. It is also an essential first step in designing information systems that interoperate. Because of this, it is good practice to store spatial metadata as well as the attribute, topological and geographic components of a spatial database.Metadata standards are necessary to make sure that that different users can find out about the suitability of data from different sources. This is particularly important if users need to compare metadata describing HER data with metadata describing, for example, rights of way or environmental information. Metadata standards set out what information should be recorded for a particular dataset and in what format. Some kinds of information may be regarded as compulsory (should always be recorded) while others may be optional either because they may not be universally relevant, or because they are useful but not essential. Metadata for a spatial dataset will enable users (or interoperating systems) to know, for example, the dates when a spatial data layer was created and/or modified, the date of the source mapping from which it derives, the scale, accuracy and precision of the data and any copyright issues that pertain to the layer and so on. Metadata standards enable metadata to be validated so that meaningful comparisons can be made between diverse spatial data sources.
There are a number of metadata initiatives within the UK geospatial community. The most relevant of these is probably _UK GEMINI_ (GEo-spatial Metadata INteroperability Initiative) launched in 2004 following a collaboration between the Association for Geographic Information (AGI) and the Cabinet Office e-Government Unit, with additional representation from national and local government and the academic community. Adherence to the UK GEMINI profile, which will replace the Gigateway Discovery Metadata Specifications (the NGDF Standard) as the UK's national geospatial metadata profile, allows for the creation of discovery metadata with both ISO 19115 (Geographic Information –Metadata) and the national e-Government Metadata Standard (eGMS), ensuring compliance with both. Adopting UK GEMINI will also simplify the process of publishing metadata via Gigateway's Data Locator.
Further details can be found at http://www.gigateway.org.uk/metadata/standards.html.
GiGateway and the National Geospatial Data Framework (NGDF)#
GiGateway replaces the National Geospatial Data Framework (NGDF). It provides a free web service aimed at increasing awareness of and access to geospatial information in the UK; offers assistance and guidance on the collection of metadata to national and international standards and provides purpose built software. GiGateway services include a Data Locator to find out what geographic datasets exist, Area Search to find out more about specific localities and Data Directory to help locate organistions which supply geographic data, products and services.NGDF produced a metadata standard for spatial information, compatible with the Dublin Core. HERs have been recommended to follow the Dublin Core for electronic resources other than GIS as this provides a standard content-description model widely used on the internet (see Miller and Greenstein 1997). At the time of writing, GiGateway is currently working on redevelopment of its MetaGenie product to create metadata in line with UK GEMINI (see above). Until then, the AGI Information Services Team urge data creators to start or continue using MetaGenie v1.0 alongside the GiGateway Discovery Metadata Specifications (Association for Geographic Information 2003) to produce and publish geospatial metadata.
Further details can be found at the GiGateway website (http://www.gigateway.org.uk/default.html).
The Intra-governmental Group on Geographic Information (IGGI)#
The Intra-governmental Group on Geographic Information (IGGI) was established in 1993 to enable central government to liaise effectively and exchange best practice in the use of geographic information. It aims to increase the efficiency of central government while enabling it to meet its responsibilities for provision of geographic information to the general public. Details can be found at the IGGI website http://www.iggi.gov.uk/welcome.php.
E.4.2 Sharing spatial data#
There are many advantages to sharing spatial datasets both within an organisation (such as a County Council) and beyond. Within large organisations shared access to spatial data can help integrate different activity areas and prevent duplication of data within the organisation (which can, in turn, lead to redundancy within the datasets and unnecessary cost through duplication of both expenditure and effort).There are also many advantages to making HER data available outside an organisation, although this raises wider issues relating to freedom of information, ownership of information and protection of heritage resources.
In both cases, there is a clear need to integrate any approach to spatial information with wider initiatives that may exist within the organisation. Many HERs will be components of wider corporate database and GIS strategies and will need to fit within these in order to benefit from data sharing within the organisation, while both local and national government is now coming to terms with the requirements of the 2000 Freedom of Information Act (The Stationery Office 2000)and how best to meet obligations placed on it under that.
Intranets#
Intranets are closed networks that are established by organisations to serve the computing needs of their staff. An intranet may be small, for example a number of computers connected to a Local Area Network (LAN) within a building, but can be very large, for example the computing networks for a series of buildings connected to a Wide Area Network (WAN). In a WAN the buildings may be widely separated, as is the case in organisations with regional offices, such as English Heritage or multinational companies. The technology that links the computers is similar to that used in the internet. The difference is that use of an intranet is restricted to those with security clearance and a valid password. Intranets are enclosed inside a firewall to secure the information held on corporate systems from unauthorised access.Intranets provide secure environments within which many users can gain access to shared resources. For GIS users, this can mean that different groups within a larger organisation can have access to the same spatial data themes permitting easier sharing of spatial data between, for example, HER, planning, rights-of-way and environment groups. This level of integration, however, usually requires significant investment by the wider organisation both in terms of technical infrastrucure and effective management.
Internet and map serving#
At present, very few (if any) HERs have made it possible for the general public to directly access spatial information on the internet. There are few technical restrictions on this, with several solutions available for 'map serving' or for creating internet interfaces to databases. There are however, currently two main issues preventing this:- Such projects would be expensive to establish and maintain. Clearly, direct access to 'live' data is rarely desirable, and so data must be regularly output from the main HER system usually requiring human intervention. Servers and infrastructure also require management for which few HERs are currently funded. Meeting the requirements of the Freedom of Information Act may change the economics, however.
- There are significant concerns about the impact on the heritage resource of making accurate, spatial locations for known archaeological sites available to the general public. It does not require a leap of imagination to see such resources becoming a favoured resource for the metal-detecting community and therefore producing a significant increase in damage to recorded (and in many cases Scheduled) monuments. Again, it is currently unclear how the requirements of the 2000 Freedom of Information Act will impact on this issue.
One recent example of online access to spatial information is Pastmap, a map-enabled query system for Scotland's Scheduled Ancient Monuments, Listed Buildings, and the National Monuments Record. This requires users to register, and once registered displays user-defined maps for the locations (and boundary polygons) for Scheduled Ancient Monuments, and locations of Listed Buildings, entries in the National Monuments Record of Scotland and Historic Gardens and Designed Landscapes (http://www.pastmap.org.uk/). (See also F.8.4.1)
E.4.3 Useful websites and references#
Dublin Core http://dublincore.org/
Arts and Humanities Data Service (AHDS):
- Main website http://ahds.ac.uk/
- Archaeology Data Service (ADS)http://archaeologydataservice.ac.uk/
- Metadata advice http://ahds.ac.uk/creating/information-papers/metadata/index.htm
IGGI website http://www.iggi.gov.uk/welcome.php
GiGateway (formerly NGDF):
- Main site http://www.gigateway.org.uk/
- Metadata standards pages http://www.gigateway.org.uk/metadata/standards.html
Z39.50
- Z39.50 http://ads.ahds.ac.uk/project/z3950/z3950.html
- NISO brochure http://www.niso.org/standards/resources/Z3950_Resources.html
E.5 Historic Landscape Characterisation#
Lynn Dyson-BruceE.5.1 Introduction to HLC#
Historic Landscape Characterisation (HLC), as applied in England, aims to provide an historic 'time depth' perspective of the landscape.Traditionally HERs have been based primarily on point, and/or polygonal data on maps, usually limited to specific findspots, buildings or monuments. This leaves parts of the landscape unclassified as to its cultural heritage. These blank spaces on the map may be perceived by those outside the sector as being of no or limited archaeological or historical value. In contrast, the HLC is a total coverage model, although at present it covers primarily the rural landscape. HLC has developed in response to changing outlooks and new government policy.
Using a range of sources, primarily cartographic, HLC assesses and classifies the current landscape in broad historic terms, on the basis of a combination of morphology and interpretation. HLC provides an audit of what has survived within the current landscape, expressed in terms of its historic origins and development. The precise classification and methodology used varies between counties and regions (for more details see Taking Stock of the Method - Aldred and Fairclough 2003), but the basic principles are similar: a pre-defined series of specific HLC Types or broader Character Types which can be grouped into broad categories based on for example urban, enclosed landscapes and woodlands. The important characteristic is that a time or period element is incorporated. Without placing any hierarchy or value on this analysis it enables an HER to assess what has survived, from what period, so that it may be managed appropriately.
E.5.2 Background#
HLC builds on Landscape Character Assessment (LCA) carried out by the Countryside Agency to address the need for a new approach to landscape assessment which looked at the whole of England's countryside rather than just specific designated areas. HLC complements LCA in many ways, looking in more detail at historic components of the landscape and increasingly forming a fundamental building block in this landscape assessment process.For LCA the landscape is assessed in terms of topography, geology and soils, ecology, and culture to allocate areas to a number of generic Landscape Character Types (LCT) which, in conjunction with informed judgement and interpretation are used to build the LCA. They are becoming increasingly GIS based applications and are being used to underpin various landscape management strategies and policies, informing a wide range of issues. Detailed regional LCA's have been brought together to form an overarching national typology, creating broad character areas, resulting in The Character of England Map (See CCN website and LCA Types and Areas Maps).
The HLC has also been compared to various LCAs across the UK with varying results (Dyson-Bruce et al 1999, Odell pers. comm., Wakelin pers. comm.) showing similarities in some areas, significant differences in others, although the reasons for this have not yet been fully researched.
Websites:#
Countryside Character Network (CCN) web site http://www.ccnetwork.org.uk/. for background to LCA, including methodological developments, speclialised urban LCA, and relationship between HLC and LCA.
Countryside Agency: Topic paper on LCA: http://www.countryside.gov.uk/Images/LCA_Topic_Paper_5_tcm2-21906.pdf
E.5.3 Development of HLC#
From a paper based exercise in the early 1990s HLC has developed to what is, currently, a developing yet sophisticated Geographic Information System (GIS) application. Practitioners not only have to be knowledgeable about archaeology, history and landscapes but also be highly IT and GIS literate. It is GIS which has revolutionised how we perceive spatial data and has enabled the creation of intelligent cogent maps in conjunction with data analysis and manipulation.E.5.4 Methodology#
Historic Landscape Character or Historic Land-use Assessment (HLA): Uniformity of principle#
Methodology has generally varied in detail from project to project, but whichever approach has been used HLC/HLA projects all share a number of common elements in that they all:- assess the total rural landscape
- look at landscape time depth by assessing surviving features
- assess landscape change through history
- assess historic origins of the landscape
- are usually applied at 1:25,000 scale
- apply a well defined (if variable) methodology
- use a specified range of historic landscape types, grouped into themes or categories for example enclosed land, industrial, 20th century, or single attributes, or types for example field types, by form, patterns woodland types for example ancient woodland.
They differ in philosophy and application in that HLA assess the landscape as to current and historic land use as well as historic character, whereas HLC assesses primarily historic character.
England#
In England HLC began with the seminal work carried out in Cornwall in the early/mid 90s (Herring 1998). This was initially a paper based exercise, developed from traditional LCA methodology; but has since become an integrated GIS application (see example figure 48 and 49). To date nearly half of England has reached completion under the leadership of English Heritage in partnership with the relevant Local authorities. (For updates on progress see the EH web site)
The East of England (EofE) HLC project, is the only application of HLC in England that uses a single but evolving methodology to ensure a consistency of application and analysis across a region (Dyson-Bruce 2002).
English Heritage commissioned a survey of HLC methodology in 2003 to develop a toolkit for future HLC applications in an attempt to harmonise HLC methodologies and to establish best practice across England. This resulted in 'Taking Stock of the Method' (Aldred and Fairclough 2003). The survey reviewed past methodologies into three major phases of development across England, and from these developed a series of proposals and established standards, as a toolkit for best pratice and future application. This document now informs the methodologies of all current HLC applications in England.
Websites:
Cornwall HLC: http://www.cornwall.gov.uk/index.cfm?articleid=5747
English Heritage: 'Taking Stock of the Method' EH website http://www.english-heritage.org.uk/server/show/nav.1293(Aldred and Fairclough 2003).
In 2003 English Heritage undertook a detailed review of the various methodologies employed and have proposed an 'HLC Toolkit' to inform future HLC's. This aims to ensure that certain standards are met, and to facilitate a uniformity of approach across England.
 |
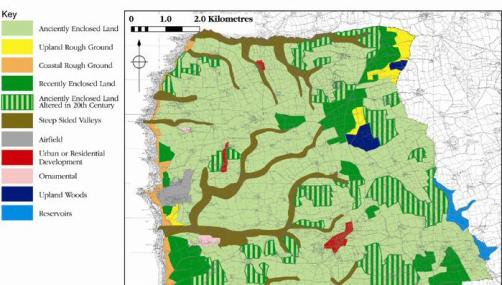 |
Scotland#
Historic Land-use Assessment (HLA) started in Scotland in 1996, led and centrally managed by the Royal Commission on the Ancient and Historical Monuments of Scotland (RCAHMS) and Historic Scotland (Historic Scotland), in conjunction with the Local Authorities (Dyson-Bruce et al 1999). A single uniform GIS based methodology is being applied across the country and approximately half of Scotland had been completed at the time of writing.The approach uses a range of single period types (current and relict) which reflect historic land use as well as character. This can result in complex maps showing palimpsests of multi-periods of discernable use within the landscape and consequently these types have been grouped into 14 broad categories, for ease of display for example Fields and Farming, Woodland and Forestry. These provide an over-arching framework, within which the specific types give the supporting detail. (Fairclough and Macinnes 2003)
Website:
RCAHMS has an interactive website, which is constantly updated, illustrating the HLA, (see - http://jura.rcahms.gov.uk/HLA/start.jsp), a sample screenshot from the website is illustrated below (figure 50).
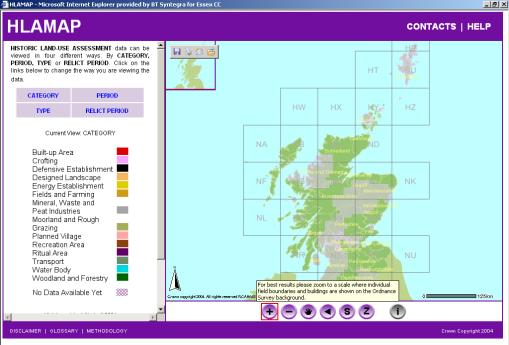 |
Wales#
Wales has adopted a different approach, and has defined a 'Register of Landscapes' of specific or outstanding interest (Cadw 1998) which ranks and values specific selected areas, but not the whole landscape. However an HLC is about to be implemented, to ensure all of the landscape has been assessed, in accord with the English and Scottish approaches.Websites:
Cadw: http://www.cadw.wales.gov.uk/.
Publication of Historic Landscapes is at http://www.cadw.wales.gov.uk/upload/resourcepool/Historic%20Landscapes9277.pdf
Sources#
Across both England and Scotland, a basic range of sources have been used, to inform, and support the HLC (Panel 10). Key datasets commonly used include the modern OS maps, the mid 19th Century 1st Edition and often an intermediary dataset like the 1950's OS maps or aerial photography. The key factors dictating their use are that they must be:- Readily available – paper or digital in format
- Cover the area in question
- At an appropriate scale
In each county there are additional locally available datasets to inform and enhance the HLC, including Tithe and Enclosure maps from which an HLC may 'pick and mix'.
The outcome of these initiatives is the creation of a broad national audit of our historic resource at the landscape scale, based on common principles. It is an approach that complements and supports other historic data such as the HER, or NMR. HLC/HLAs can be applied at a range of scales from district to county to regional.
Developments in Methodology#
HLC is now a fully GIS application, with an increasing level of complexity of databases, either linked flat files or incorporating geodatabases (object-oriented). The methodology is developing and maturing with greater experience and breadth of application. GIS also enables digital combination of HLC data with other datasets.A wide variety of outputs can be created, not just custom coloured maps creating schematic or thematic maps at various scales, but also analysis and statistics, which in turn generate charts and graphs, based on the underlying databases of information supporting the GIS mapping of HLC. There is increased flexibility and interoperability of systems, not only between GIS software but with other standard PC software. This facilitates data exchange and use.
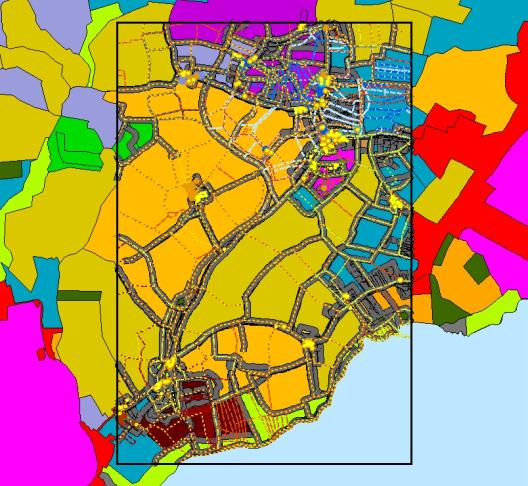 |
Consequently the HLC approach is under constant change and development in response to changes in thinking, political drivers and pressures, in parallel with improved GIS technology and data (see case studies below) in order to create a better application and also one for wider and specialised use.
- Urban HLC Enhanced forms of HLC are being developed, for example Urban based HLC, using a more fine grained approach – assessing and classifying the urban environment in greater detail than rural HLC (see below). This approach is currently being developed in Lancashire, Cornwall, Northern England and in Hertfordshire (a pilot study in Stevenage). See illustration from Cornwall, figure 52. It is thought this more detailed approach will sit alongside Historic Buildings and Conservation Areas and the more recent Extended Urban Survey's (EUS) providing an historic urban context for more detailed studies and site based data.
- Coastal HLC currently being developed by EH to assess the coastal margins, from the High Water Mark (HWM), out as far as the statutory limit (12 nautical miles). This will assess not only any historic data but also archaeological potential based on geology and topography. This is in response to current and future threats to such archaeological and historical material within the littoral coastal zone, from, for example, coastal erosion, deep fishing and mineral extraction.
- An enhanced HLC, also incorporating fieldwork, looking in detail at field boundaries, their history and current condition in response to the proposed areas for minerals extraction, has been applied in Hertfordshire (Bryant and Hunn 2004).
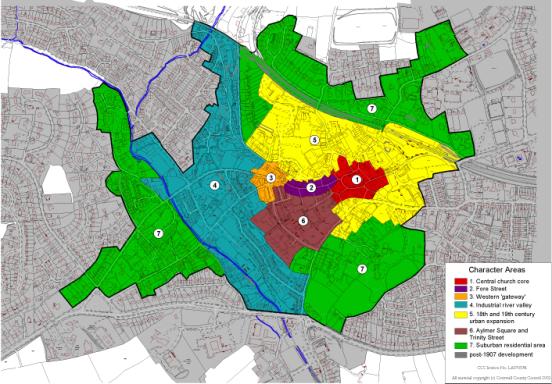 |
E.5.5 Issues relating to how HLC may complement the HER#
There are many questions and/or issues to be considered before embarking on integrated data management of HLC in conjunction with HER datasets. What it is intended to achieve and why? How the product might be used in the future and how it fits in with the HERs IT and GIS data structure within its parent organisation. Serious consideration should be given to the pragmatic, logical and effective steps needed to create what would be a useful and universal tool, also the manner in which it might subsequently be developed and applied.In planning to create an integrated series of records to form a more complete HER one must consider the diverse nature of the various datasets, in detail, scale and quality. In any approach, where the data will be combined in some way, it will be essential to have national standards and guidelines to ensure a uniform approach and a compatibility of standards and the resulting datasets. This would have the added advantage of adding credibility to heritage asset management and records.
Such a nationally established HER and HLC protocol could extend the range and effectiveness of current methods of heritage management, contribute further to conservation, landscape management, development control work, research and so forth, and allow the heritage sector to operate on the same national basis as other regional or national bodies in areas such as, Regional Spatial Strategies (RSS), Strategic Environmental Assessments (SEA) and to help inform change indicators such as 'Countryside Quality Counts'.
The main approaches to combining HLC with HER datasets may be either as parallel or integrated datasets. Integrated, object oriented geo-databases would be a way forward, but would require good GIS skills to achieve this more advanced GIS data structure, with improved conformity in data quality and content, not least well defined and generally accepted spatial extents.
The data within the various HERs is variable in content, quality and structure, reflecting a wide variety of material from single finds to complex and extensive excavations, and development over a long period of time. On HER mapping sites are usually located by a six figure NGR and represented in GIS as an X-Y point – although there is an increasing thrust to convert these points to polygonal data, reflecting the sites true geographic coverage. Other digital data includes for example, the National Mapping Programme (NMP).
HLCs also differ in nature, quality and form with great variation between phases in the development of the methodology and their application across England. Recent projects have shown that the assimilation of different forms of HLC to create cross-border models can be achieved (for example Went et al 2003: Green and Kidd 2004: Chris Blandford Associates 2004).
Given that the data held within the HER record is complex and variable, often held in different data structures how is HLC best used or incorporated with such digital datasets?
(See 'Is there a Point in the Polygon?' Dyson-Bruce 2004) http://www.heritagegateway.org.uk/Gateway/News/ArchivedNews.htm Historic Environment Record News Feb 2004.
Rationalising the HER and HLC data#
There may be many ways of doing this, in practical or technical terms - but the following ideas or types of approach are suggested:To achieve some national strategy to gain conformity in data, a rationalisation, with defined data standards and structure may well be required to synthesise all these variable forms of data, both HLC and HER in themselves, prior to their being brought together in a single or series of linked databases into a fully integrated HER. This would enable full and consistent interoperability, application and analysis. The drawback is that, this may stymie future development and change, but on the other hand would ensure national conformity in data gathering, collation, analysis and management. However due to the diversity of dataset structure and content in the HLC and HER there may be no single solution.
Given the variability of HLCs, the integration of all HLCs into a nationally consistent dataset would require a rationalisation of the data, and data migration into new data structures with various levels of synthesis and interpretation of the extant data. A clear and well defined vision would be required to ensure conformity.
For an HER there would have to be some data cleansing or filtering process of duplicate, suspect and inconsistent data. In addition point data may need to polygonised, which introduces issues of where to place the boundary of sites. For example, Listed Buildings, which may have an unclear spatial definition – what part of the building, or series of buildings, how much of the grounds or curtilage are to be incorporated, that is, what is its 'footprint'? Similarly, Scheduled Monuments may have an defined edge that may well not conform to OS digital data. All these would require digitising as unique polygons, with all associated records.
One could cluster data together, such as finds scatters, crop marks or clusters of listed buildings with other historically significant buildings. This would require definition of a cluster – number, proximity, area and so forth, using consistent criteria, for example perhaps using a convex hull technique (whereby GIS 'lassos' a line, around a cluster of selected point data into a group which may then be represented as a polygon, possibly with an additional buffer zone). However the information would require additional interpretation by type, period, or a synthesis. Again they may well not conform to OS defined areas. These clusters or groupings of data could form various 'management layers', representing a new layer of generic or categorised information within the HER. This could perhaps be more easily understood and assimilated by other users that are non-archaeologists.
Whilst this process is being initiated and implemented, it would be opportune to fully consider future applications. With appropriate thought the data cleansing and manipulation could provide the answer to a wider variety of remits and end uses, that is a more useful streamlined management tool and resource.
HLC in parallel or imbedded into HER#
Alternatively the HLC and HER datasets could sit in parallel with each other to be used interactively within GIS, for reactive or iterative display or analysis. The separate datasets are displayed within GIS using the functionality within GIS display (using legends to allow overlaying of multiple datasets – transparency and appropriate symbology), or for analysis (for example by spatial location, or by using attributes).One option is for a hierarchical system: the overarching broad HLC with the finer grained detailed HER, both possibly displaying at different scales. So as one zoomed in the HLC would fade as the HER records came into sharper focus. Hertfordshire County Council has used a series of nesting polygonal data for redefining the HER – which proved time consuming and thus may not be universally practicable (S Bryant pers. comm.).
HLC integrated into HER#
The HLC and HER datasets could be combined into a single resource – as a 'single source of truth or information' whereby the HLC becomes an integral part of the HER system.exeGesIS SDM Ltd has developed an 'HLC Module' for the HBSMR system whereby, using a rules based, hierarchical system (see figure 53), of broad generic groups or categories (macro), with types, sub-types or attributes providing the detail (micro), with associated material, has enabled an integration of the HLC within the HER. It is an inter active system, the HER and HLC are embedded together into their spatial context. This approach has been piloted in Norfolk in its application of HLC.
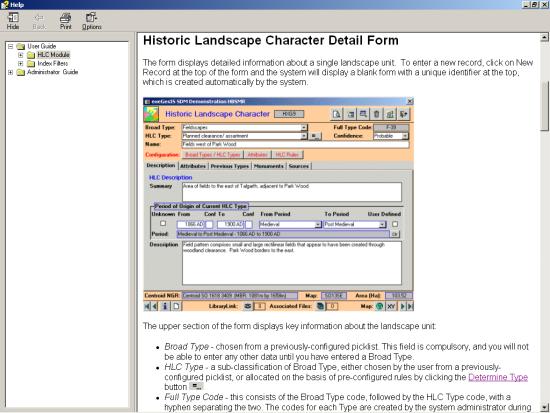 |
E.5.6 Data maintenance and update#
Increasingly as areas are completed, the issues of data management, maintenance and update, of not only the basic records but also the subsequent syntheses, will need to be addressed. With time, data will be updated, errors found and corrected with new interpretations and additional data gathered, requiring inputting not only in to HER but HLC datasets. HER data is readily updateable, within extant GIS systems designed for such purposes. The HLC as yet does not have a well defined management system, and there are other related issues. For example the HLCs represent a timeline of data synthesis of the state of the landscape at that time – therefore there are additional issues of archive copies, with live updated current versions of the HLC, that is versioning of the GIS dataset to create an established series of time-lines or versions of update.Other issues are that of dissemination, training and use of such records within the wider community, costs or fees for use, training, web access and management. Who is going to provide the resource for the maintenance of these new more holistic, encompassing and integrated HERs?
E.5.7 Applications for HLC#
HLC has many uses and applications from simple viewing of layers to more complex analysis.It is advised to consult The Applications of HLC (Clarke et al 2004), illustrated here, which describes in detail, the main uses to which HLC has been put to date – though it is thought there are many other potential applications yet to be identified.
The ranges of application vary from heritage, archaeological potential mapping, sensitivity mapping, conservation zones, landscape (LCA), farming, agri-environment schemes, minerals, coastal zone management, planning (strategy and policy), development control, research, local applications, parish surveys and public outreach. The list is constantly expanding with greater awareness of HLC and HER data and with greater experience.
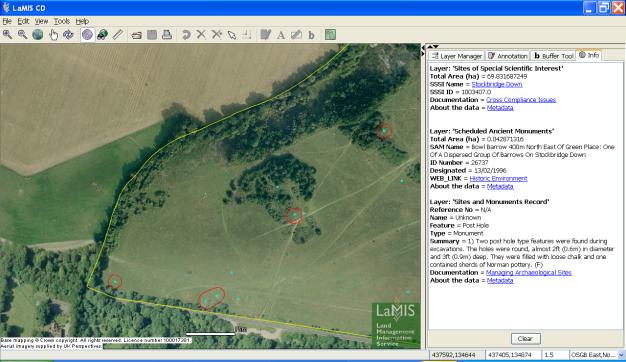 |
HLC in conjunction with other historic data can support the Entry Level Schemes (ELS) and Higher Level Schemes (HLS) under Common Agricultural Policy, replacing the former Countryside Stewardship and ESAs schemes. The Land Management Information Service (LaMIS) illustrated here (figure 54) is one response to this issue. It supplies map-based information, including HER data, to assist farmers and other land mangers in devising appropriate ELS and HLS applications and in meeting their cross-compliance obligations.
The potential for modelling HLC has yet to be realised and here there is great promise awaiting development. Future modelling may well be dictated in response to various issues, of HLC in conjunction with other data – whether historic or from other sources, for example ecological, natural, census, sociological. A few ideas are noted below, to stimulate further work.
Similarly, the people who may use HLC in pursuit of their activities range far and wide in their backgrounds and levels of expertise and will no doubt expand as HLC data becomes more widely known and accepted.
Panel 10: Potential Modelling for HLC#
The HLC may be used within itself for analysis and modelling, for example models of degree of landscape change or survival. However, more powerful and meaningful analysis may be accomplished in conjunction with other datasets. One may use such data to build models in response to various issues, for example degrees of landscape sensitivity to certain forms of development or threat. The more datasets used would in turn create more complex models for more in-depth scenario building.HLC Landscape Types - to reflect
- Rarity
- Commonality
- Continuity
- Change
- Spatial distribution
HLC based Landscape Themes – to reflect
- Period based for example 20th century, 18th century or earlier, prehistoric
- Time zones
- Origin of formation
- Broad types, for example Agricultural, Settlement, Industrial, Recreation
- Sensitivity
- Capacity for change
- Values
HLC Modelled with Other Data
Other Data
- Historic for example HER, LB, SMs, MMP
- Political – parishes
- Natural – geology, soils, rainfall, climate
- Habitats – SSSIs, biodiversity, ecology, hedgerow species
- Contour – aspect, 3D, view shed analysis
- Statistical – census, farming, economic
- Landcover Change data for example CORINE, Macaulay
- Water resource, rivers, rainfall
E.5.8 Case studies#
HLC has been used with a variety of forms of historic data either for visual display or interactive analysis in various applications. The difficulties of combining HER and other historic datasets with HLC have been highlighted and examined as parts of various projects involving GIS analysis. Each approach handled the HER and other historic data with HLC in differing ways, in response to various issues and scales of application. These case studies illustrate some of the issues and problems in combining such different forms of historic records.Suffolk#
In Suffolk HLC has been used as an independent backdrop to select HER point data to compare distribution patterns in Suffolk to the HLC. In addition certain ecological records have been plotted to establish if there are any correlations with distribution and HLC. (E. Martin, pers comm.)Scotland#
In Scotland a selection of prehistoric (Neolithic and Bronze Age) NMR point data was modelled in comparison to the HLA to see how past land-use affected monument survival and condition; how an RCAHMS Farm Building Survey on Sanday, and the HLA, independently complemented each other; and how RCAHMS fieldwork compared with the HLA on Skye and in the Grampians (Dyson-Bruce et al 1999).South East England#
The following three case studies were carried out in response to the ODPM's Sustainable Development reports targeting the South East for circa 1 million new homes in the next 25-30 years. English Heritage sought to develop a series of proactive responses, guiding and informing appropriate development based on modelling 'historic character' rather than issuing a series of the more traditional heritage constraints in such scenarios. The London-Cambridge-Stansted Study sought to define a strategic analysis based on sensitivity to inform the process of development. Whereas the Milton Keynes and Thames gateway studies already had pre-defined zones for development and sought to develop integrated historic environment modelling to inform and guide future development in these areas. (Further details of all of the projects are available on the, see details below).London-Stansted-Cambridge – M11 (Went et al 2003): The LSC- M11 work highlighted the problems in taking two radically different HER's (one monument based, the other event based) in adjacent counties and incorporating them into two county-based HLC's using the same methodology (see figure 55). The results confirmed that a certain screening or filtering of the HER data was required (which was unfortunately outwith the remit of the project, but is currently being progressed).
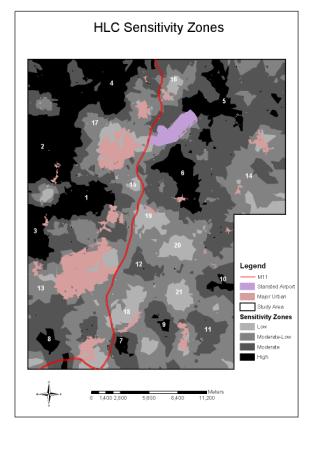 |
The project sought to provide a strategic approach of devising a 'sensitivity system' to the HLC data to facilitate strategic planning; the where, what and how. A scoring system was used, based on:
- Age, rarity or special interest
- History of change
- Landscape coherence
- Dominant characteristics
From these a generic model of low/low-moderate/moderate/high sensitivity scores were generated, which gave a range of 21 sensitivity zones (Figure 55). Associated with these are various advisory notes on criteria and capacity for and the zones correlated to current development proposals.
Milton Keynes South Midlands (Green and Kidd 2004): The MKSM work took a different approach, using comparative analysis of HLC and HER with other data to inform 15 'Historic Landscape Zones'. These zones were then used in defining criteria for location assessment for potential growth.
The Historic environment was assessed using
- Historic landscape - HLC
- Historic buildings – Listed Buildings
- Archaeological sites – SM and HER data
- Visual setting
A rating of positive, neutral and negative (serious/moderate/minor) was then assigned to the data to suggest a potential spatial framework for the Milton Keynes Growth Area (see figure 56).
 |
 |
Thames-Gateway, (Blandford and Associates and EH, 2004): This study developed an integrated historic environment approach. Thames Gateway used the datasets to create three themes or heritage management layers:
- Historic Landscape - HLC
- Urban Areas – primarily Listed Buildings
- Archaeology – HER data
The project separated the major forms of heritage data into comparable suites of information as they could not be incorporated satisfactorily into a single integrated suite of data. These three ranges of data were used to inform a final layer of 'Historic Environment Characterisation', with 140 character areas.
E.5.9 Future Developments#
The future of HLC relies on wide ranging use and lateral application, not only within the heritage sector but within many other disciplines. HLC is capable of various enhancement projects, looking into either fine grained detailed studies of field types or parish studies involving earlier sources, for example tithe and enclosure or estate maps. An overarching HLC synthesis producing a national HLC generic map of landscape history and development is surely an end objective, which would complement the maps produced by the Countryside Agency.E.5.10 Useful web sites#
Natural England (formerly Countryside Agency) Landscape Character Assessment:- http://www.countryside.gov.uk/LAR/Landscape/CC/countryside_character.asp
- http://www.countryside.gov.uk/LAR/Landscape/CC/landscape_character_assesment.asp - guidance and links to downloadable topic papers on LCA with HLC, GIS, sensitivity, development and other issues
Countryside Character Network - for general information http://www.ccnetwork.org.uk/
CIS – Countryside Information System http://www.cis-web.org.uk/home/
DEFRA – Department for Environment Food and Rural Affairs http://www.defra.gov.uk/
English Heritage
Sustainable Communities: http://www.english-heritage.org.uk/server/show/ConWebDoc.5976
- The London Cambridge Stansted M11 Study - http://www.english-heritage.org.uk/upload/pdf/hist_env_issues_lscreport.pdf
- The Milton Keynes Study http://www.english-heritage.org.uk/upload/pdf/CB47_02_StrategicDevelopment.pdf
- Thames Gateway http://www.english-heritage.org.uk/upload/pdf/Final_report_textonly.pdf
Historic Landscape Characterisation: http://www.english-heritage.org.uk/server/show/nav.1293
- Using Historic Landscape Characterisation http://www.english-heritage.org.uk/upload/pdf/a4report.pdf
ELC – European Landscape Convention, Council of Europe, EEC http://conventions.coe.int/Treaty/en/Treaties/Html/176.htm
HS – Historic Scotland http://www.historic-scotland.gov.uk/ - for general information.
Land Management Information System LaMiS – an electronic Geographic Information System which enables farmers to develop appropriate land management, either for day to day management, long term planning agri-environment schemes or to formulate new plans for diversification. It is being piloted in Hampshire, North Yorkshire Moors and Sussex http://lamis.everysite.co.uk/lamis/.
MAGIC – MAGIC is the first web-based interactive map to bring together information on key environmental schemes and designations, in one place. MAGIC is a partnership project involving seven government organisations who have responsibilities for rural policy-making and management, and although it has been designed to meet the needs of the partner organisations, the facility is available to anyone over the Internet. http://www.magic.gov.uk/.
RCAHMS – Royal Commission on the Ancient and Historical Monuments of Scotland
- http://www.rcahms.gov.uk/ - for general information. The site has an an excellent web based introduction to HLA in Scotland.
- http://jura.rcahms.gov.uk/HLA/start.jsp - for online maps of the HLA of completed areas in Scotland.
RCAHMW - Royal Commission on the Ancient and Historical Monuments of Wales http://www.rcahmw.gov.uk/.
E.5.11 Solving the ‘HLA in Planning’ Problem: Aberdeenshire case study#
Bruce Mann, Aberdeenshire Council One question currently echoing around Local Authorities is what can we do with Historic Landuse Assessment (HLA) data? In Aberdeenshire this is being addressed by integrating part of the HLA data into the Sites & Monuments Record (SMR). HLA not only presents a broad indication of the sweep from moors in the highlands down to farming in the lowlands, it also tells a more complex story. After the dataset had been made available across Aberdeenshire’s Planning Service as an overlay on its GIS, there was uncertainty about what to do with this story. Multiple landscape types varying in period and use proved to be difficult to interpret for untrained staff. Considering the pressures that Development Control (DC) officers already faced in dealing with planning applications and the numerous issues to consider as potential constraints, it was decided to incorporate HLA into the planning system in a different way from its existing overlay. Responsibilty for interpretation of the data resided with the Archaeology Service within the Council, which allowed the logical step of moving information from HLA into the SMR so that landscapes could be presented as archaeological sites (see figures 57 and 58).Obviously not all landuse types as defined in HLA can be made into archaeological sites. HLA on the whole provides a historical landscape setting in which the monuments lie, something that will be used in the contexts of strategic policy decisions in the future. For the purpose of examining how rare landscape types in HLA could be integrated into planning it was decided to use Designed Landscapes as the initial example.
As with all Local Authorities there is a separate inventory for Historic Gardens and Designed Landscapes. The Inventory for Aberdeenshire contains 26 examples of national importance, leaving a far greater number identified through HLA falling outside of the ‘special consideration’ given to those on the list. By taking such landscapes and giving them archaeological designations the following processes had to be undertaken:
- Using the Designed Landscape type as a template, as displayed on the HLA overlay, the landscapes were added to the archaeological GIS overlay as polygons defining the exact area covered. The polygons were then linked to an entry in the SMR database. This had the effect of creating a unique site record for each designed landscape that integrated seamlessly into the overall SMR.
- A consensus was reached among the parties that would normally comment on planning applications relating to designed landscapes as to how all comments would be presented to a developer. This involved the Environment Planners (landscape, projects, natural heritage), the Built & Cultural Heritage Planners (listed buildings, conservation, archaeology) and where appropriate selected team leaders/managers. A new flagging system was established in which all parties were informed of a pending application and allowed to forward their comments to one document that went out in response.
- A new model development brief dealing solely with the archaeological concerns of designed landscapes was written. This allowed a standard set of mitigation measures aimed specifically at designed landscapes to be put into place that supplemented other planning considerations such as Tree Preservation Orders and so forth. This model brief can also act as an aid for a developer during pre-scoping talks prior to a formal application being submitted.
- New supplementary planning guidance notes were written with the aim of clarifying for planning staff what a designed landscape is, the typical features found within it, and what to preserve.
- A draft version of the new Archaeology Policy for the Local Plan was created. The new policy will include HLA as a whole and act as a broad context for all the landscape types that may be flagged up in the future as being nationally or regionally important.
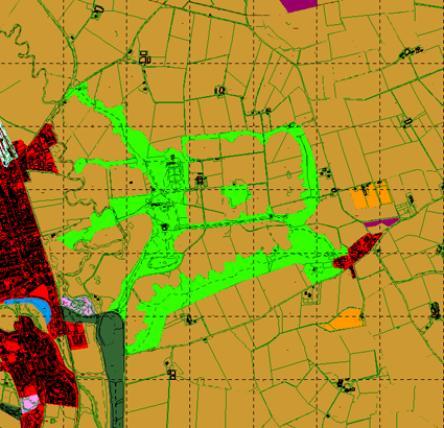 |
The immediate benefit of SMR integration and removal of the HLA dataset from the DC process was that it removed the need for extensive training in interpretation and guidance for staff. The additional problem of why DC should consider HLA in the first place, when there are currently no policies that mention it, was also resolved, as the land-use types now became archaeological sites on the GIS overlays. Following this successfully adaptation of one part of HLA to suit the planning system, in particular development control, we can draw several conclusions:
- HLA should be presented to a Council in two formats: the first is the original dataset that anyone can use at a strategic level. The second is a modified version of the data that is simpler to use and understand by untrained staff. This could follow Aberdeenshire’s example of putting selected portions of the data such as designed landscapes or relict landuse types into other, current, databases such as the SMR so that staff do not have to do the interpretation.
- The policies in the Structure and Local Plans need to take into account HLA and the question of landscape setting within their wording. This will ensure that policy teams and DC consider HLA.
- Guidance notes and development briefs have to be written for each landscape type that is to be protected in order to achieve consistency and understanding, including dealing with the practical need to manage the key features of these landscapes without precluding acceptable development. This goes beyond the current guidelines issued by HLA.
- When dealing with entire landscapes there will always be several sections of Planning that will want to comment on applications. A unified approach must be adopted for responses so that a developer knows what is wanted from the outset.
By integrating the important landscape types from HLA into the SMR and packaging them with their own guidance notes and so forth, a very flexible system can be created that adapts to changing pressures from developers. It also makes the landscapes easier to understand for planning staff and could perhaps help form a detailed manual on HLA interpretation for the future in the Council. But perhaps the most important aspect is that the story HLA is telling is no longer being missed.
 |