E.1: Historic Landscape Characterisation
- E.1 Historic Landscape Characterisation
- E.1.1 Introduction to HLC
- E.1.2 Background
- Websites:
- E.1.3 Development of HLC
- E.1.4 Methodology
- Historic Landscape Character or Historic Land-use Assessment (HLA): Uniformity of principle
- England
- Scotland
- Wales
- Sources
- Developments in Methodology
- E.1.5 Issues relating to how HLC may complement the HER
- Rationalising the HER and HLC data
- HLC in parallel or imbedded into HER
- HLC integrated into HER
- E.1.6 Data maintenance and update
- E.1.7 Applications for HLC
- Panel 10: Potential Modelling for HLC
- E.1.8 Case studies
- Suffolk
- Scotland
- South East England
- Birmingham HLC
- E.1.9 Future Developments
- E.1.10 Useful web sites
- E.1.11 Solving the ‘HLA in Planning’ Problem: Aberdeenshire case study
E.1 Historic Landscape Characterisation#
Lynn Dyson-BruceE.1.1 Introduction to HLC#
Historic Landscape Characterisation (HLC), as applied in England, aims to provide an historic 'time depth' perspective of the landscape.Traditionally HERs have been based primarily on point, and/or polygonal data on maps, usually limited to specific findspots, buildings or monuments. This leaves parts of the landscape unclassified as to its cultural heritage. These blank spaces on the map may be perceived by those outside the sector as being of no or limited archaeological or historical value. In contrast, the HLC is a total coverage model, although at present it covers primarily the rural landscape. HLC has developed in response to changing outlooks and new government policy.
Using a range of sources, primarily cartographic, HLC assesses and classifies the current landscape in broad historic terms, on the basis of a combination of morphology and interpretation. HLC provides an audit of what has survived within the current landscape, expressed in terms of its historic origins and development. The precise classification and methodology used varies between counties and regions (for more details see ''Taking Stock of the Method'' - Aldred and Fairclough 2003), but the basic principles are similar: a pre-defined series of specific HLC Types or broader Character Types which can be grouped into broad categories based on for example urban, enclosed landscapes and woodlands. The important characteristic is that a time or period element is incorporated. Without placing any hierarchy or value on this analysis it enables an HER to assess what has survived, from what period, so that it may be managed appropriately.
E.1.2 Background#
HLC builds on Landscape Character Assessment (LCA) carried out by the Countryside Agency to address the need for a new approach to landscape assessment which looked at the whole of England's countryside rather than just specific designated areas. HLC complements LCA in many ways, looking in more detail at historic components of the landscape and increasingly forming a fundamental building block in this landscape assessment process.For LCA the landscape is assessed in terms of topography, geology and soils, ecology, and culture to allocate areas to a number of generic Landscape Character Types (LCT) which, in conjunction with informed judgement and interpretation are used to build the LCA. They are becoming increasingly GIS based applications and are being used to underpin various landscape management strategies and policies, informing a wide range of issues. Detailed regional LCA's have been brought together to form an overarching national typology, creating broad character areas, resulting in The Character of England Map (See CCN website and LCA Types and Areas Maps).
The HLC has also been compared to various LCAs across the UK with varying results (Dyson-Bruce et al 1999, Odell pers. comm., Wakelin pers. comm.) showing similarities in some areas, significant differences in others, although the reasons for this have not yet been fully researched.
Websites:#
Countryside Character Network (CCN) web site http://www.naturalengland.org.uk/ourwork/landscape/englands/character/lcn/default.aspx . for background to LCA, including methodological developments, speclialised urban LCA, and relationship between HLC and LCA.
Countryside Agency: Topic paper on LCA: http://www.naturalengland.org.uk/Images/lcatopicpaper5_tcm6-8176.pdf
E.1.3 Development of HLC#
From a paper based exercise in the early 1990s HLC has developed to what is, currently, a developing yet sophisticated Geographic Information System (GIS) application. Practitioners not only have to be knowledgeable about archaeology, history and landscapes but also be highly IT and GIS literate. It is GIS which has revolutionised how we perceive spatial data and has enabled the creation of intelligent cogent maps in conjunction with data analysis and manipulation.E.1.4 Methodology#
Historic Landscape Character or Historic Land-use Assessment (HLA): Uniformity of principle#
Methodology has generally varied in detail from project to project, but whichever approach has been used HLC/HLA projects all share a number of common elements in that they all:- assess the total rural landscape
- look at landscape time depth by assessing surviving features
- assess landscape change through history
- assess historic origins of the landscape
- are usually applied at 1:25,000 scale
- apply a well defined (if variable) methodology
- use a specified range of historic landscape types, grouped into themes or categories for example enclosed land, industrial, 20th century, or single attributes, or types for example field types, by form, patterns woodland types for example ancient woodland.
They differ in philosophy and application in that HLA assess the landscape as to current and historic land use as well as historic character, whereas HLC assesses primarily historic character.
England#
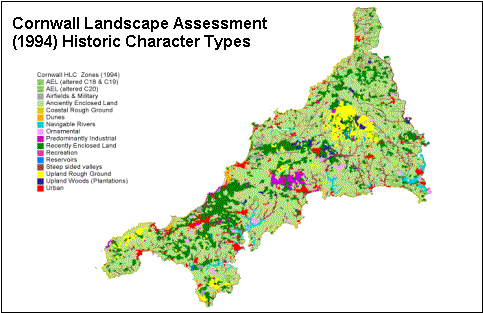
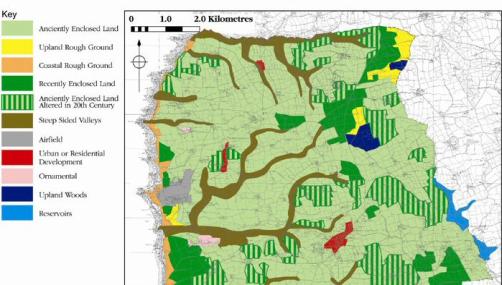
In England HLC began with the seminal work carried out in Cornwall in the early/mid 90s (Herring 1998). This was initially a paper based exercise, developed from traditional LCA methodology; but has since become an integrated GIS application (see example figure 48 and 49). To date nearly half of England has reached completion under the leadership of English Heritage in partnership with the relevant Local authorities. (For updates on progress see the Historic England web site )
)
The East of England (EofE) HLC project, is the only application of HLC in England that uses a single but evolving methodology to ensure a consistency of application and analysis across a region (Dyson-Bruce 2002).
English Heritage commissioned a survey of HLC methodology in 2003 to develop a toolkit for future HLC applications in an attempt to harmonise HLC methodologies and to establish best practice across England. This resulted in 'Taking Stock of the Method' (Aldred and Fairclough 2003). The survey reviewed past methodologies into three major phases of development across England, and from these developed a series of proposals and established standards, as a toolkit for best pratice and future application. This document now informs the methodologies of all current HLC applications in England.
Websites:
Cornwall HLC: http://www.cornwall.gov.uk/default.aspx?page=22352
English Heritage: 'Taking Stock of the Method' EH website (Aldred and Fairclough 2003).
In 2003 English Heritage undertook a detailed review of the various methodologies employed and have proposed an 'HLC Toolkit' to inform future HLC's. This aims to ensure that certain standards are met, and to facilitate a uniformity of approach across England.
 |
 |
Scotland#
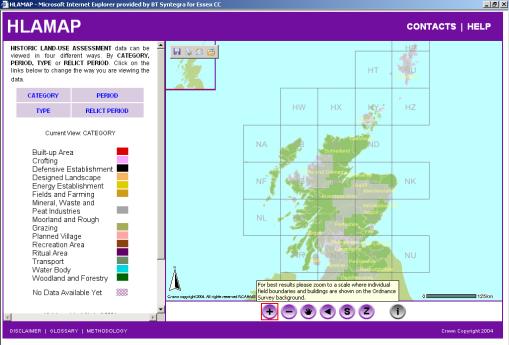
Historic Land-use Assessment (HLA) started in Scotland in 1996, led and centrally managed by the Royal Commission on the Ancient and Historical Monuments of Scotland (RCAHMS) and Historic Scotland (Historic Scotland), in conjunction with the Local Authorities (Dyson-Bruce et al 1999). A single uniform GIS based methodology has been applied across the country. HLA can be viewed online (http://hlamap.org.uk/ ) or downloaded for use in GIS.
The approach uses a range of single period types (current and relict) which reflect historic land use as well as character. This can result in complex maps showing palimpsests of multi-periods of discernable use within the landscape and consequently these types have been grouped into 14 broad categories, for ease of display for example Fields and Farming, Woodland and Forestry. These provide an over-arching framework, within which the specific types give the supporting detail. (Fairclough and Macinnes 2003)
 |
Wales#
Wales has adopted a different approach, and has defined a 'Register of Landscapes' of specific or outstanding interest (Cadw 1998) which ranks and values specific selected areas, but not the whole landscape. A programme of Historic Landscape Characterization has been undertaken on each of the registered landscapes and the methodology exists to characterize any part of the landscape outside the register. Further information on this methodology can be found in Dave Thompson and Daffyd Gwyn's introduction to a typical HLC report such that for The vale of Llangollen .
.
Further information about Historic Landscapes in Wales can be found on the Cadw website at http://cadw.gov.wales/historicenvironment/protection/historiclandscapes/?lang=en
Natural Resources Wales have also worked on landscape assessment including that of the historic landscape, in conjunction with the Welsh Archaeological Trusts, as part of their extensive LANDMAP project. Further information about this can be found on their website at https://naturalresources.wales/planning-and-development/landmap/?lang=en .
.
Sources#
Across both England and Scotland, a basic range of sources have been used, to inform, and support the HLC (Panel 10). Key datasets commonly used include the modern OS maps, the mid 19th Century 1st Edition and often an intermediary dataset like the 1950's OS maps or aerial photography. The key factors dictating their use are that they must be:- Readily available – paper or digital in format
- Cover the area in question
- At an appropriate scale
In each county there are additional locally available datasets to inform and enhance the HLC, including Tithe and Enclosure maps from which an HLC may 'pick and mix'.
The outcome of these initiatives is the creation of a broad national audit of our historic resource at the landscape scale, based on common principles. It is an approach that complements and supports other historic data such as the HER, NRHE or NMR. HLC/HLAs can be applied at a range of scales from district to county to regional.
Developments in Methodology#
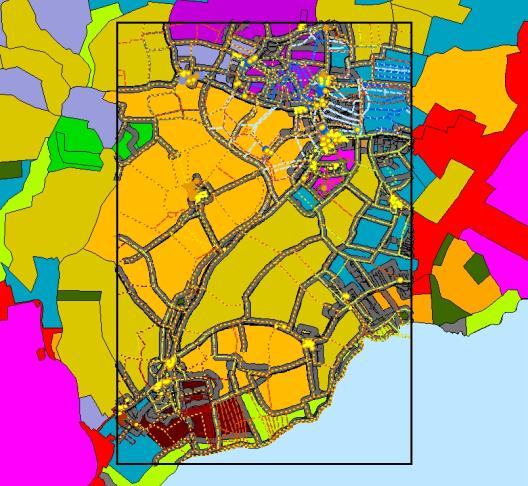
HLC is now a fully GIS application, with an increasing level of complexity of databases, either linked flat files or incorporating geodatabases (object-oriented). The methodology is developing and maturing with greater experience and breadth of application. GIS also enables digital combination of HLC data with other datasets.A wide variety of outputs can be created, not just custom coloured maps creating schematic or thematic maps at various scales, but also analysis and statistics, which in turn generate charts and graphs, based on the underlying databases of information supporting the GIS mapping of HLC. There is increased flexibility and interoperability of systems, not only between GIS software but with other standard PC software. This facilitates data exchange and use.
 |
Consequently the HLC approach is under constant change and development in response to changes in thinking, political drivers and pressures, in parallel with improved GIS technology and data (see case studies below) in order to create a better application and also one for wider and specialised use.
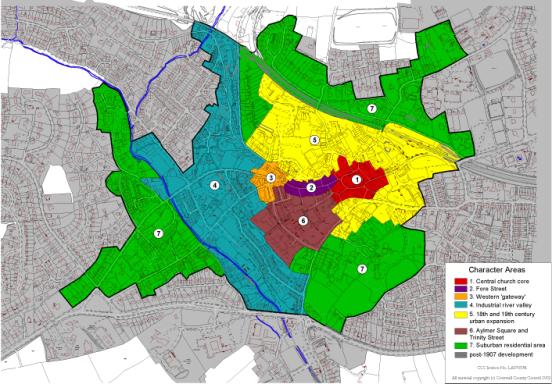
- Urban HLC Enhanced forms of HLC are being developed, for example Urban based HLC, using a more fine grained approach – assessing and classifying the urban environment in greater detail than rural HLC (see below). This approach is currently being developed in Lancashire, Cornwall, Northern England and in Hertfordshire (a pilot study in Stevenage). See illustration from Cornwall, figure 52. It is thought this more detailed approach will sit alongside Historic Buildings and Conservation Areas and the more recent Extended Urban Survey's (EUS) providing an historic urban context for more detailed studies and site based data.
- Coastal HLC currently being developed by EH to assess the coastal margins, from the High Water Mark (HWM), out as far as the statutory limit (12 nautical miles). This will assess not only any historic data but also archaeological potential based on geology and topography. This is in response to current and future threats to such archaeological and historical material within the littoral coastal zone, from, for example, coastal erosion, deep fishing and mineral extraction.
- An enhanced HLC, also incorporating fieldwork, looking in detail at field boundaries, their history and current condition in response to the proposed areas for minerals extraction, has been applied in Hertfordshire (Bryant and Hunn 2004).
 |
E.1.5 Issues relating to how HLC may complement the HER#
There are many questions and/or issues to be considered before embarking on integrated data management of HLC in conjunction with HER datasets. What it is intended to achieve and why? How the product might be used in the future and how it fits in with the HERs IT and GIS data structure within its parent organisation. Serious consideration should be given to the pragmatic, logical and effective steps needed to create what would be a useful and universal tool, also the manner in which it might subsequently be developed and applied.In planning to create an integrated series of records to form a more complete HER one must consider the diverse nature of the various datasets, in detail, scale and quality. In any approach, where the data will be combined in some way, it will be essential to have national standards and guidelines to ensure a uniform approach and a compatibility of standards and the resulting datasets. This would have the added advantage of adding credibility to heritage asset management and records.
Such a nationally established HER and HLC protocol could extend the range and effectiveness of current methods of heritage management, contribute further to conservation, landscape management, development control work, research and so forth, and allow the heritage sector to operate on the same national basis as other regional or national bodies in areas such as, Regional Spatial Strategies (RSS), Strategic Environmental Assessments (SEA) and to help inform change indicators such as 'Countryside Quality Counts'.
The main approaches to combining HLC with HER datasets may be either as parallel or integrated datasets. Integrated, object oriented geo-databases would be a way forward, but would require good GIS skills to achieve this more advanced GIS data structure, with improved conformity in data quality and content, not least well defined and generally accepted spatial extents.
The data within the various HERs is variable in content, quality and structure, reflecting a wide variety of material from single finds to complex and extensive excavations, and development over a long period of time. On HER mapping sites are usually located by a six figure NGR and represented in GIS as an X-Y point – although there is an increasing thrust to convert these points to polygonal data, reflecting the sites true geographic coverage. Other digital data includes for example, the National Mapping Programme (NMP).
HLCs also differ in nature, quality and form with great variation between phases in the development of the methodology and their application across England. Recent projects have shown that the assimilation of different forms of HLC to create cross-border models can be achieved (for example Went et al 2003: Green and Kidd 2004: Chris Blandford Associates 2004).
Given that the data held within the HER record is complex and variable, often held in different data structures how is HLC best used or incorporated with such digital datasets?
(See 'Is there a Point in the Polygon?' Dyson-Bruce 2004)
Rationalising the HER and HLC data#
There may be many ways of doing this, in practical or technical terms - but the following ideas or types of approach are suggested:To achieve some national strategy to gain conformity in data, a rationalisation, with defined data standards and structure may well be required to synthesise all these variable forms of data, both HLC and HER in themselves, prior to their being brought together in a single or series of linked databases into a fully integrated HER. This would enable full and consistent interoperability, application and analysis. The drawback is that, this may stymie future development and change, but on the other hand would ensure national conformity in data gathering, collation, analysis and management. However due to the diversity of dataset structure and content in the HLC and HER there may be no single solution.
Given the variability of HLCs, the integration of all HLCs into a nationally consistent dataset would require a rationalisation of the data, and data migration into new data structures with various levels of synthesis and interpretation of the extant data. A clear and well defined vision would be required to ensure conformity.
For an HER there would have to be some data cleansing or filtering process of duplicate, suspect and inconsistent data. In addition point data may need to polygonised, which introduces issues of where to place the boundary of sites. For example, Listed Buildings, which may have an unclear spatial definition – what part of the building, or series of buildings, how much of the grounds or curtilage are to be incorporated, that is, what is its 'footprint'? Similarly, Scheduled Monuments may have an defined edge that may well not conform to OS digital data. All these would require digitising as unique polygons, with all associated records.
One could cluster data together, such as finds scatters, crop marks or clusters of listed buildings with other historically significant buildings. This would require definition of a cluster – number, proximity, area and so forth, using consistent criteria, for example perhaps using a convex hull technique (whereby GIS 'lassos' a line, around a cluster of selected point data into a group which may then be represented as a polygon, possibly with an additional buffer zone). However the information would require additional interpretation by type, period, or a synthesis. Again they may well not conform to OS defined areas. These clusters or groupings of data could form various 'management layers', representing a new layer of generic or categorised information within the HER. This could perhaps be more easily understood and assimilated by other users that are non-archaeologists.
Whilst this process is being initiated and implemented, it would be opportune to fully consider future applications. With appropriate thought the data cleansing and manipulation could provide the answer to a wider variety of remits and end uses, that is a more useful streamlined management tool and resource.
HLC in parallel or imbedded into HER#
Alternatively the HLC and HER datasets could sit in parallel with each other to be used interactively within GIS, for reactive or iterative display or analysis. The separate datasets are displayed within GIS using the functionality within GIS display (using legends to allow overlaying of multiple datasets – transparency and appropriate symbology), or for analysis (for example by spatial location, or by using attributes).One option is for a hierarchical system: the overarching broad HLC with the finer grained detailed HER, both possibly displaying at different scales. So as one zoomed in the HLC would fade as the HER records came into sharper focus. Hertfordshire County Council has used a series of nesting polygonal data for redefining the HER – which proved time consuming and thus may not be universally practicable (S Bryant pers. comm.).
HLC integrated into HER#
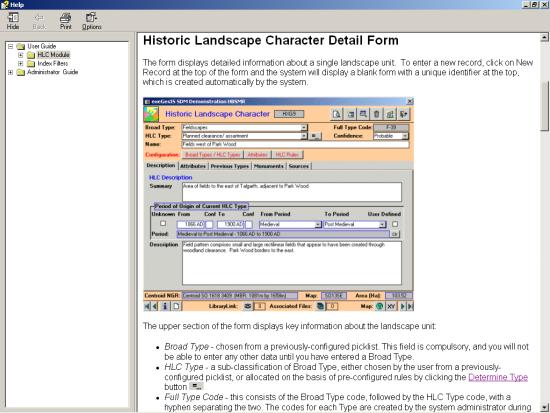
The HLC and HER datasets could be combined into a single resource – as a 'single source of truth or information' whereby the HLC becomes an integral part of the HER system.exeGesIS SDM Ltd has developed an 'HLC Module' for the HBSMR system whereby, using a rules based, hierarchical system (see figure 53), of broad generic groups or categories (macro), with types, sub-types or attributes providing the detail (micro), with associated material, has enabled an integration of the HLC within the HER. It is an inter active system, the HER and HLC are embedded together into their spatial context. This approach has been piloted in Norfolk in its application of HLC.
 |
E.1.6 Data maintenance and update#
Increasingly as areas are completed, the issues of data management, maintenance and update, of not only the basic records but also the subsequent syntheses, will need to be addressed. With time, data will be updated, errors found and corrected with new interpretations and additional data gathered, requiring inputting not only in to HER but HLC datasets. HER data is readily updateable, within extant GIS systems designed for such purposes. The HLC as yet does not have a well defined management system, and there are other related issues. For example the HLCs represent a timeline of data synthesis of the state of the landscape at that time – therefore there are additional issues of archive copies, with live updated current versions of the HLC, that is versioning of the GIS dataset to create an established series of time-lines or versions of update.Other issues are that of dissemination, training and use of such records within the wider community, costs or fees for use, training, web access and management. Who is going to provide the resource for the maintenance of these new more holistic, encompassing and integrated HERs?
E.1.7 Applications for HLC#
HLC has many uses and applications from simple viewing of layers to more complex analysis.It is advised to consult The Applications of HLC (in Clarke et al 2004), illustrated here, which describes in detail, the main uses to which HLC has been put to date – though it is thought there are many other potential applications yet to be identified.
The ranges of application vary from heritage, archaeological potential mapping, sensitivity mapping, conservation zones, landscape (LCA), farming, agri-environment schemes, minerals, coastal zone management, planning (strategy and policy), development control, research, local applications, parish surveys and public outreach. The list is constantly expanding with greater awareness of HLC and HER data and with greater experience.
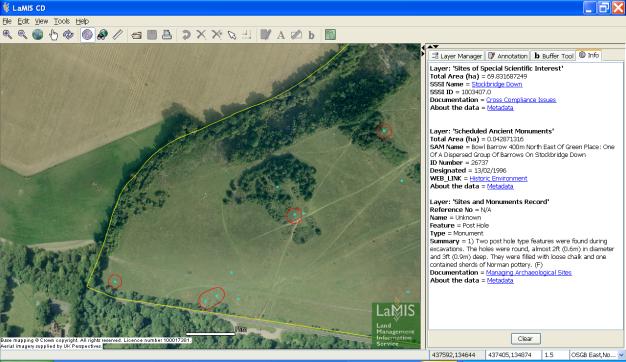 |
HLC in conjunction with other historic data can support the Entry Level Schemes (ELS) and Higher Level Schemes (HLS) under Common Agricultural Policy, replacing the former Countryside Stewardship and ESAs schemes. The Land Management Information Service (LaMIS) illustrated here (figure 54) is one response to this issue. It supplies map-based information, including HER data, to assist farmers and other land mangers in devising appropriate ELS and HLS applications and in meeting their cross-compliance obligations.
The potential for modelling HLC has yet to be realised and here there is great promise awaiting development. Future modelling may well be dictated in response to various issues, of HLC in conjunction with other data – whether historic or from other sources, for example ecological, natural, census, sociological. A few ideas are noted below, to stimulate further work.
Similarly, the people who may use HLC in pursuit of their activities range far and wide in their backgrounds and levels of expertise and will no doubt expand as HLC data becomes more widely known and accepted.
Panel 10: Potential Modelling for HLC#
The HLC may be used within itself for analysis and modelling, for example models of degree of landscape change or survival. However, more powerful and meaningful analysis may be accomplished in conjunction with other datasets. One may use such data to build models in response to various issues, for example degrees of landscape sensitivity to certain forms of development or threat. The more datasets used would in turn create more complex models for more in-depth scenario building.HLC Landscape Types - to reflect
- Rarity
- Commonality
- Continuity
- Change
- Spatial distribution
HLC based Landscape Themes – to reflect
- Period based for example 20th century, 18th century or earlier, prehistoric
- Time zones
- Origin of formation
- Broad types, for example Agricultural, Settlement, Industrial, Recreation
- Sensitivity
- Capacity for change
- Values
HLC Modelled with Other Data
Other Data
- Historic for example HER, LB, SMs, MMP
- Political – parishes
- Natural – geology, soils, rainfall, climate
- Habitats – SSSIs, biodiversity, ecology, hedgerow species
- Contour – aspect, 3D, view shed analysis
- Statistical – census, farming, economic
- Landcover Change data for example CORINE, Macaulay
- Water resource, rivers, rainfall
E.1.8 Case studies#
HLC has been used with a variety of forms of historic data either for visual display or interactive analysis in various applications. The difficulties of combining HER and other historic datasets with HLC have been highlighted and examined as parts of various projects involving GIS analysis. Each approach handled the HER and other historic data with HLC in differing ways, in response to various issues and scales of application. These case studies illustrate some of the issues and problems in combining such different forms of historic records.Suffolk#
In Suffolk HLC has been used as an independent backdrop to select HER point data to compare distribution patterns in Suffolk to the HLC. In addition certain ecological records have been plotted to establish if there are any correlations with distribution and HLC. (E. Martin, pers comm.)Scotland#
In Scotland a selection of prehistoric (Neolithic and Bronze Age) NMR point data was modelled in comparison to the HLA to see how past land-use affected monument survival and condition; how an RCAHMS Farm Building Survey on Sanday, and the HLA, independently complemented each other; and how RCAHMS fieldwork compared with the HLA on Skye and in the Grampians (Dyson-Bruce et al 1999).South East England#
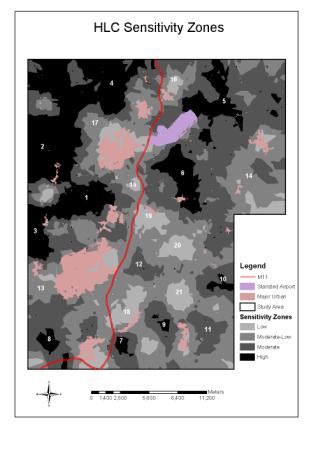
The following three case studies were carried out in response to the ODPM's Sustainable Development reports targeting the South East for circa 1 million new homes in the next 25-30 years. English Heritage sought to develop a series of proactive responses, guiding and informing appropriate development based on modelling 'historic character' rather than issuing a series of the more traditional heritage constraints in such scenarios. The London-Cambridge-Stansted Study sought to define a strategic analysis based on sensitivity to inform the process of development. Whereas the Milton Keynes and Thames gateway studies already had pre-defined zones for development and sought to develop integrated historic environment modelling to inform and guide future development in these areas. (Further details of all of the projects are available on the, see details below).London-Stansted-Cambridge – M11 (Went et al 2003): The LSC- M11 work highlighted the problems in taking two radically different HER's (one monument based, the other event based) in adjacent counties and incorporating them into two county-based HLC's using the same methodology (see figure 55). The results confirmed that a certain screening or filtering of the HER data was required (which was unfortunately outwith the remit of the project, but is currently being progressed).
 |
The project sought to provide a strategic approach of devising a 'sensitivity system' to the HLC data to facilitate strategic planning; the where, what and how. A scoring system was used, based on:
- Age, rarity or special interest
- History of change
- Landscape coherence
- Dominant characteristics
From these a generic model of low/low-moderate/moderate/high sensitivity scores were generated, which gave a range of 21 sensitivity zones (Figure 55). Associated with these are various advisory notes on criteria and capacity for and the zones correlated to current development proposals.
Milton Keynes South Midlands (Green and Kidd 2004): The MKSM work took a different approach, using comparative analysis of HLC and HER with other data to inform 15 'Historic Landscape Zones'. These zones were then used in defining criteria for location assessment for potential growth.
The Historic environment was assessed using
- Historic landscape - HLC
- Historic buildings – Listed Buildings
- Archaeological sites – SM and HER data
- Visual setting
A rating of positive, neutral and negative (serious/moderate/minor) was then assigned to the data to suggest a potential spatial framework for the Milton Keynes Growth Area (see figure 56).
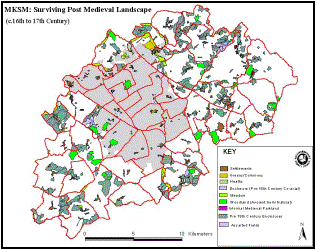 |
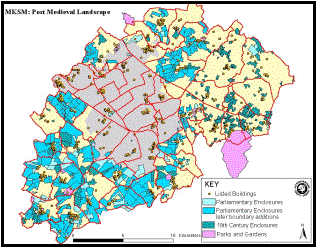 |
Thames-Gateway, (Blandford and Associates and EH, 2004): This study developed an integrated historic environment approach. Thames Gateway used the datasets to create three themes or heritage management layers:
- Historic Landscape - HLC
- Urban Areas – primarily Listed Buildings
- Archaeology – HER data
The project separated the major forms of heritage data into comparable suites of information as they could not be incorporated satisfactorily into a single integrated suite of data. These three ranges of data were used to inform a final layer of 'Historic Environment Characterisation', with 140 character areas.
Birmingham HLC#
Balancing conflicting requirements during the creation of the Birmingham HLC: characterisation accuracy and detail vs. manageable polygon sizes and record numbers
Completed in December 2014, the historic landscape characterisation of Birmingham covers 26,798 ha (66,219 acres) and its database contains 6,974 HLC records, afterwards also combined into 111 broad character areas. 38 broad and 432 ‘individual’ HLC types are used to describe the Birmingham HLC records and – derived from them – another 18 and respectively 124 types for the character areas. Aiming to map, date and describe as accurately as possible the wide variety of past and present land use ‘realities’ encountered ‘on the ground’ – that is depicted in (or inferred from) the mainly cartographic sources used during the characterisation process - the Birmingham HLC used a number of approaches in order to achieve its intended characterisation accuracy while at the same time avoiding excessive fragmentation of the polygons drawn and/or an unworkable increase in the number of records captured.
1. Using ‘multi-polygon’ HLC records
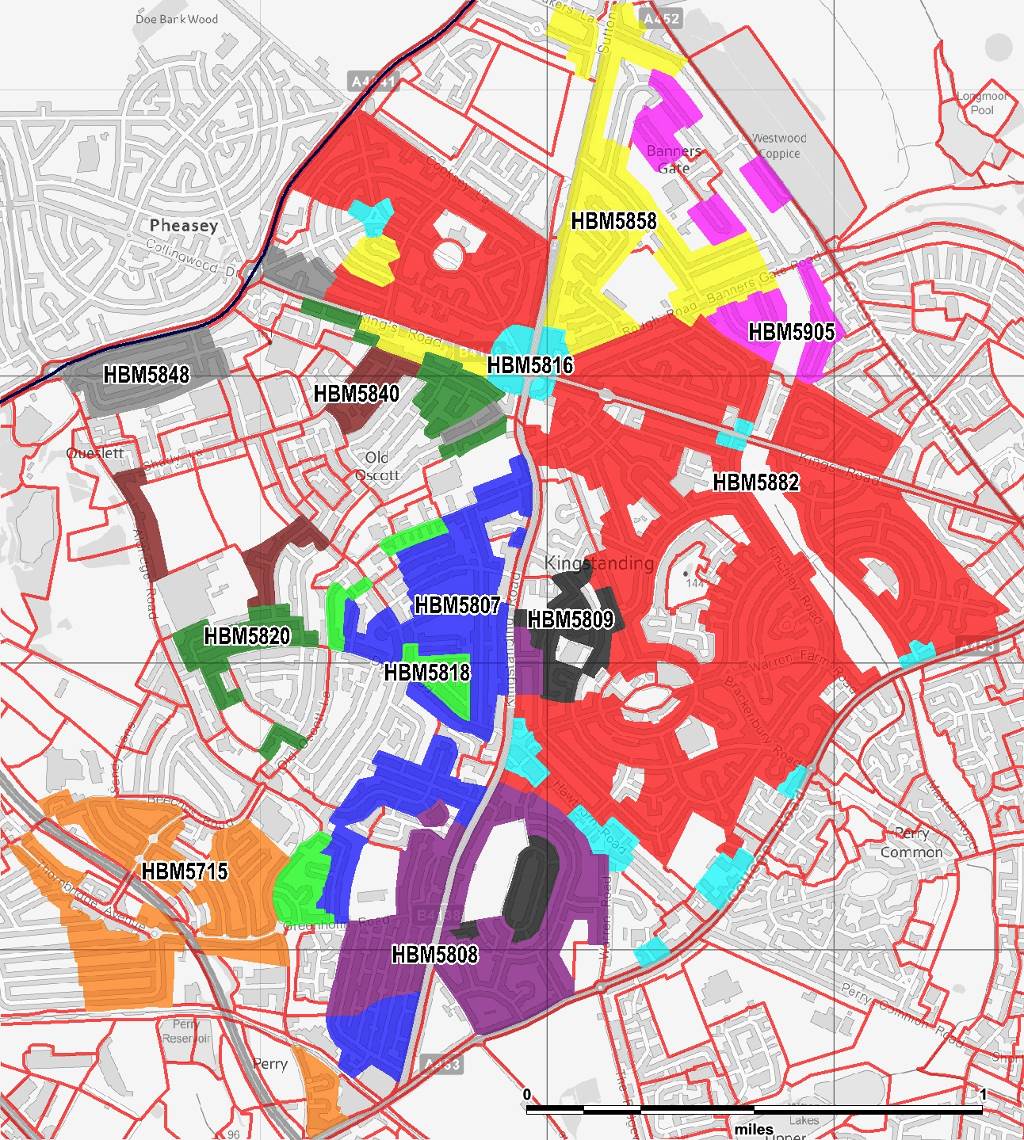
Using this innovative approach, two or more polygons with (near-) identical land use ‘histories’ and typologies, and located relatively close to each other (though obviously not spatially contiguous), were attached to a single newly-created HLC record. As the GIS and HER software used to draw and record data (MapInfo and HBSMR) posed no problems in this respect, the ‘multi-polygon’ approach was implemented wherever deemed suitable, to the extent that the Birmingham HLC database now contains some 2,000 more polygons (c. 8,975) than actual records (6,974). This represents a significant reduction in the number of potential records contained in the Birmingham HLC database, without compromising the accuracy and detail of the characterisation itself. The size and nature of the (mainly) 1930s Kingstanding Estate in north-west Birmingham – one of the largest inter-war housing estates in the country – made it eminently suitable for the ‘multi-polygon’ HLC record approach, as illustrated by the 12 HLC records highlighted in this map. Also the estate is bisected by two dual-carriageway roads (‘polygonised’ as well by the Birmingham HLC) meeting in its centre, while the M6 motorway cuts across its south-western corner. The current HLC broad type of all the 12 records highlighted in the illustration is Residential, apart from one (HBM5816) which includes (almost) all of the retail facilities present on the estate and is made up of no fewer than 13 polygons (!) – four of them created purely as a result of the dual carriageway roads’ junction. As expected, the current ‘period of origin’ of most of these 12 HLC records is the 1930s, apart from three dated to the late 1940s and the 1950s. Drawing the HLC polygons also had to take into account the boundaries of the ancient Perry Barr Common (enclosed around 1815) which cut across of the modern estate. This resulted in 4 of the highlighted 12 ‘multi-polygon’ HLC records being purposely drawn so as to lie entirely within the area of the former commons.
 |
2. Using ‘mixed’ HLC types
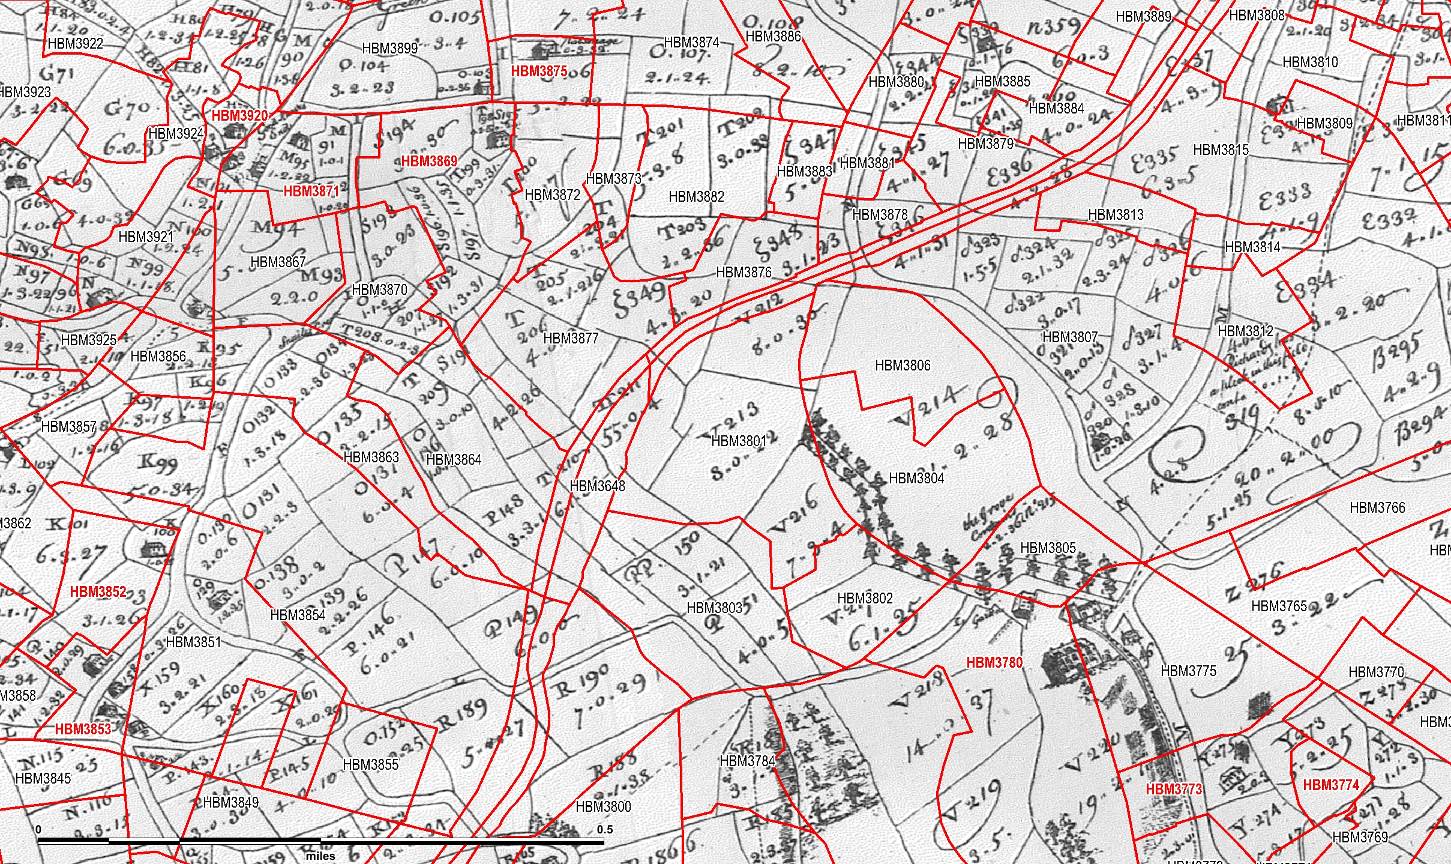
Where attempting to draw along the boundary between two different land use types, dates or both, would have resulted in unworkable polygon shapes (e.g. a patchwork of interspersed ‘mini-polygons’ belonging to only two records), the alternative chosen most often by the Birmingham HLC was to incorporate everything into just one polygon/record and then characterise it using a mixed HLC broad and ‘individual’ type (and/or also tweak its period of origin). In fact, more than a quarter of the 38 broad land use types employed by the Birmingham HLC are a ‘mixture’ of two (or more) existing types (originally inherited from the Black Country HLC); they combine for example Residential with Industrial or Commercial, Fields, Outdoor Recreational, Social/Public etc. While additional HLC broad and ‘individual’ types have to be created as a consequence, this ‘typological trade-off’ is more than compensated by the characterisation accuracy and dataset size benefits. The need to use ‘mixed’ types occurred throughout the Birmingham HLC particularly when characterising certain past land use realities, such as the combination of Victorian terraces and small works common in many parts of the city before the extensive post-war re-developments, or the combination of cottages, houses, smallholdings, alongside their closes and gardens, specific of the (semi-)dispersed settlement pattern of the pre-industrial era. Mixed HLC types were not exclusively used for describing past land realities though, as for example the Industrial and Commercial type was also used extensively to characterise current situations where traditional manufacturing had been replaced by industrial/trading/business/technology estates/parks. An example of the need to use mixed HLC types is characterising pre-modern Edgbaston – as illustrated by this map from 1718 – manor which lacked a ‘true’ village centre and consisted largely of houses, farms and cottages scattered in groups of two and three at best, including those in the vicinity of Edgbaston Hall and Church (HBM3780) – all record numbers mentioned here are highlighted in red on the map. In order to have any chance of ‘capturing’ at least part of this dispersed pattern, the resulting Birmingham HLC records had to either stay small (e.g. HBM3853 – 1.8 ha or HBM3875 – 1.44 ha), or use the ‘farm and enclosed fields’ mixed HLC type (e.g. HBM3852, HBM3869 or HBM3773, the latter farm located next to its Medieval moated predecessor – HBM3774). Incidentally, the closest thing to an Edgbaston ‘village centre’ in pre-modern times, was the small hamlet at Good Knaves End (top left corner), area covered by only two HLC records: a very small one (HBM3920 – 0.95 ha) and a larger one (HBM3871 – 2.71 ha), larger only because it also includes a small country house and its grounds.
 |
We firmly believe that both methodological approaches described above worked well in practice during the characterisation process, and that together they helped keep the size of the Birmingham HLC dataset – and thus also the workload required to create it – manageable, without compromising the accuracy of drawing, dating and describing its records.
E.1.9 Future Developments#
The future of HLC relies on wide ranging use and lateral application, not only within the heritage sector but within many other disciplines. HLC is capable of various enhancement projects, looking into either fine grained detailed studies of field types or parish studies involving earlier sources, for example tithe and enclosure or estate maps. An overarching HLC synthesis producing a national HLC generic map of landscape history and development is surely an end objective, which would complement the maps produced by the Countryside Agency.E.1.10 Useful web sites#
Natural England (formerly Countryside Agency) Landscape Character Assessment:- http://www.naturalengland.org.uk/ourwork/landscape/englands/character/default.aspx

- http://www.naturalengland.org.uk/ourwork/landscape/englands/character/assessment/default.aspx
 - guidance and links to downloadable topic papers on LCA with HLC, GIS, sensitivity, development and other issues
Countryside Character Network - for general information http://www.naturalengland.org.uk/ourwork/landscape/englands/character/lcn/default.aspx
__CIS__ – Countryside Information System [http://www.cis-web.org.uk/home/
DEFRA – Department for Environment Food and Rural Affairs https://www.gov.uk/government/organisations/department-for-environment-food-rural-affairs
English Heritage
Sustainable Communities: http://www.historicengland.org.uk/images-books/publications/conservation-bulletin-47/
- The Milton Keynes Study http://www.buckscc.gov.uk/assets/content/bcc/docs/archaeology/A_MKUE_File1.pdf

- Thames Gateway https://www.historicengland.org.uk/images-books/publications/thames-gateway-historic-environment-characterisation-project-final-report/

Historic Landscape Characterisation: http://www.historicengland.org.uk/research/current-research/discovery/landscapes-and-areas/characterisation/historic-landscape-character/
- Using Historic Landscape Characterisation https://www.historicengland.org.uk/images-books/publications/using-historic-landscape-characterisation/

ELC – European Landscape Convention, Council of Europe, EEC http://conventions.coe.int/Treaty/en/Treaties/Html/176.htm
HS – Historic Scotland http://www.historic-scotland.gov.uk/ - for general information.
Land Management Information System LaMiS – an electronic Geographic Information System which enables farmers to develop appropriate land management, either for day to day management, long term planning agri-environment schemes or to formulate new plans for diversification. It is being piloted in Hampshire, North Yorkshire Moors and Sussex http://lamis.everysite.co.uk/lamis/ .
.
MAGIC – MAGIC is the first web-based interactive map to bring together information on key environmental schemes and designations, in one place. MAGIC is a partnership project involving seven government organisations who have responsibilities for rural policy-making and management, and although it has been designed to meet the needs of the partner organisations, the facility is available to anyone over the Internet. http://www.magic.gov.uk/ .
.
RCAHMS – Royal Commission on the Ancient and Historical Monuments of Scotland
- http://www.rcahms.gov.uk/
 - for general information. The site has an an excellent web based introduction to HLA in Scotland.
- http://jura.rcahms.gov.uk/HLA/start.jsp
 - for online maps of the HLA of completed areas in Scotland.
RCAHMW - Royal Commission on the Ancient and Historical Monuments of Wales http://www.rcahmw.gov.uk/ .
.
E.1.11 Solving the ‘HLA in Planning’ Problem: Aberdeenshire case study#
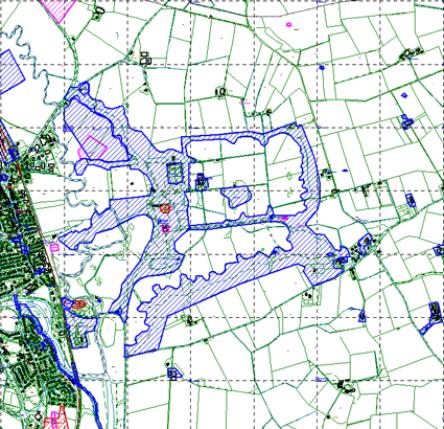
Bruce Mann, Aberdeenshire Council One question currently echoing around Local Authorities is what can we do with Historic Landuse Assessment (HLA) data? In Aberdeenshire this is being addressed by integrating part of the HLA data into the Sites & Monuments Record (SMR). HLA not only presents a broad indication of the sweep from moors in the highlands down to farming in the lowlands, it also tells a more complex story. After the dataset had been made available across Aberdeenshire’s Planning Service as an overlay on its GIS, there was uncertainty about what to do with this story. Multiple landscape types varying in period and use proved to be difficult to interpret for untrained staff. Considering the pressures that Development Control (DC) officers already faced in dealing with planning applications and the numerous issues to consider as potential constraints, it was decided to incorporate HLA into the planning system in a different way from its existing overlay. Responsibilty for interpretation of the data resided with the Archaeology Service within the Council, which allowed the logical step of moving information from HLA into the SMR so that landscapes could be presented as archaeological sites (see figures 57 and 58).Obviously not all landuse types as defined in HLA can be made into archaeological sites. HLA on the whole provides a historical landscape setting in which the monuments lie, something that will be used in the contexts of strategic policy decisions in the future. For the purpose of examining how rare landscape types in HLA could be integrated into planning it was decided to use Designed Landscapes as the initial example.
As with all Local Authorities there is a separate inventory for Historic Gardens and Designed Landscapes. The Inventory for Aberdeenshire contains 26 examples of national importance, leaving a far greater number identified through HLA falling outside of the ‘special consideration’ given to those on the list. By taking such landscapes and giving them archaeological designations the following processes had to be undertaken:
- Using the Designed Landscape type as a template, as displayed on the HLA overlay, the landscapes were added to the archaeological GIS overlay as polygons defining the exact area covered. The polygons were then linked to an entry in the SMR database. This had the effect of creating a unique site record for each designed landscape that integrated seamlessly into the overall SMR.
- A consensus was reached among the parties that would normally comment on planning applications relating to designed landscapes as to how all comments would be presented to a developer. This involved the Environment Planners (landscape, projects, natural heritage), the Built & Cultural Heritage Planners (listed buildings, conservation, archaeology) and where appropriate selected team leaders/managers. A new flagging system was established in which all parties were informed of a pending application and allowed to forward their comments to one document that went out in response.
- A new model development brief dealing solely with the archaeological concerns of designed landscapes was written. This allowed a standard set of mitigation measures aimed specifically at designed landscapes to be put into place that supplemented other planning considerations such as Tree Preservation Orders and so forth. This model brief can also act as an aid for a developer during pre-scoping talks prior to a formal application being submitted.
- New supplementary planning guidance notes were written with the aim of clarifying for planning staff what a designed landscape is, the typical features found within it, and what to preserve.
- A draft version of the new Archaeology Policy for the Local Plan was created. The new policy will include HLA as a whole and act as a broad context for all the landscape types that may be flagged up in the future as being nationally or regionally important.
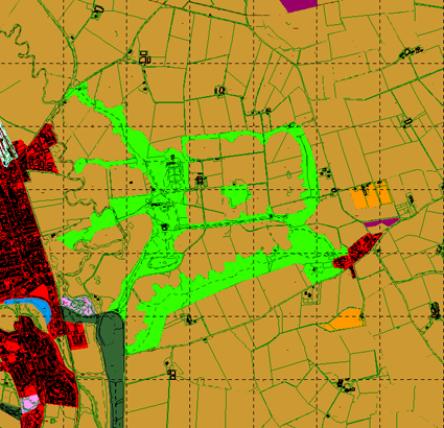 |
The immediate benefit of SMR integration and removal of the HLA dataset from the DC process was that it removed the need for extensive training in interpretation and guidance for staff. The additional problem of why DC should consider HLA in the first place, when there are currently no policies that mention it, was also resolved, as the land-use types now became archaeological sites on the GIS overlays. Following this successfully adaptation of one part of HLA to suit the planning system, in particular development control, we can draw several conclusions:
- HLA should be presented to a Council in two formats: the first is the original dataset that anyone can use at a strategic level. The second is a modified version of the data that is simpler to use and understand by untrained staff. This could follow Aberdeenshire’s example of putting selected portions of the data such as designed landscapes or relict landuse types into other, current, databases such as the SMR so that staff do not have to do the interpretation.
- The policies in the Structure and Local Plans need to take into account HLA and the question of landscape setting within their wording. This will ensure that policy teams and DC consider HLA.
- Guidance notes and development briefs have to be written for each landscape type that is to be protected in order to achieve consistency and understanding, including dealing with the practical need to manage the key features of these landscapes without precluding acceptable development. This goes beyond the current guidelines issued by HLA.
- When dealing with entire landscapes there will always be several sections of Planning that will want to comment on applications. A unified approach must be adopted for responses so that a developer knows what is wanted from the outset.
By integrating the important landscape types from HLA into the SMR and packaging them with their own guidance notes and so forth, a very flexible system can be created that adapts to changing pressures from developers. It also makes the landscapes easier to understand for planning staff and could perhaps help form a detailed manual on HLA interpretation for the future in the Council. But perhaps the most important aspect is that the story HLA is telling is no longer being missed.
 |