Tim Evans + Kirsty Ackland
Everyone loves a map…
One of the tasks we’re currently tackling in the OASIS redevelopment is the Location module. This is probably the most important facet of new OASIS; not only is accurate recording of a place a fundamental to everyone’s work, but within workflows project locale subsequently helps generate a lot of data in other modules of the form.
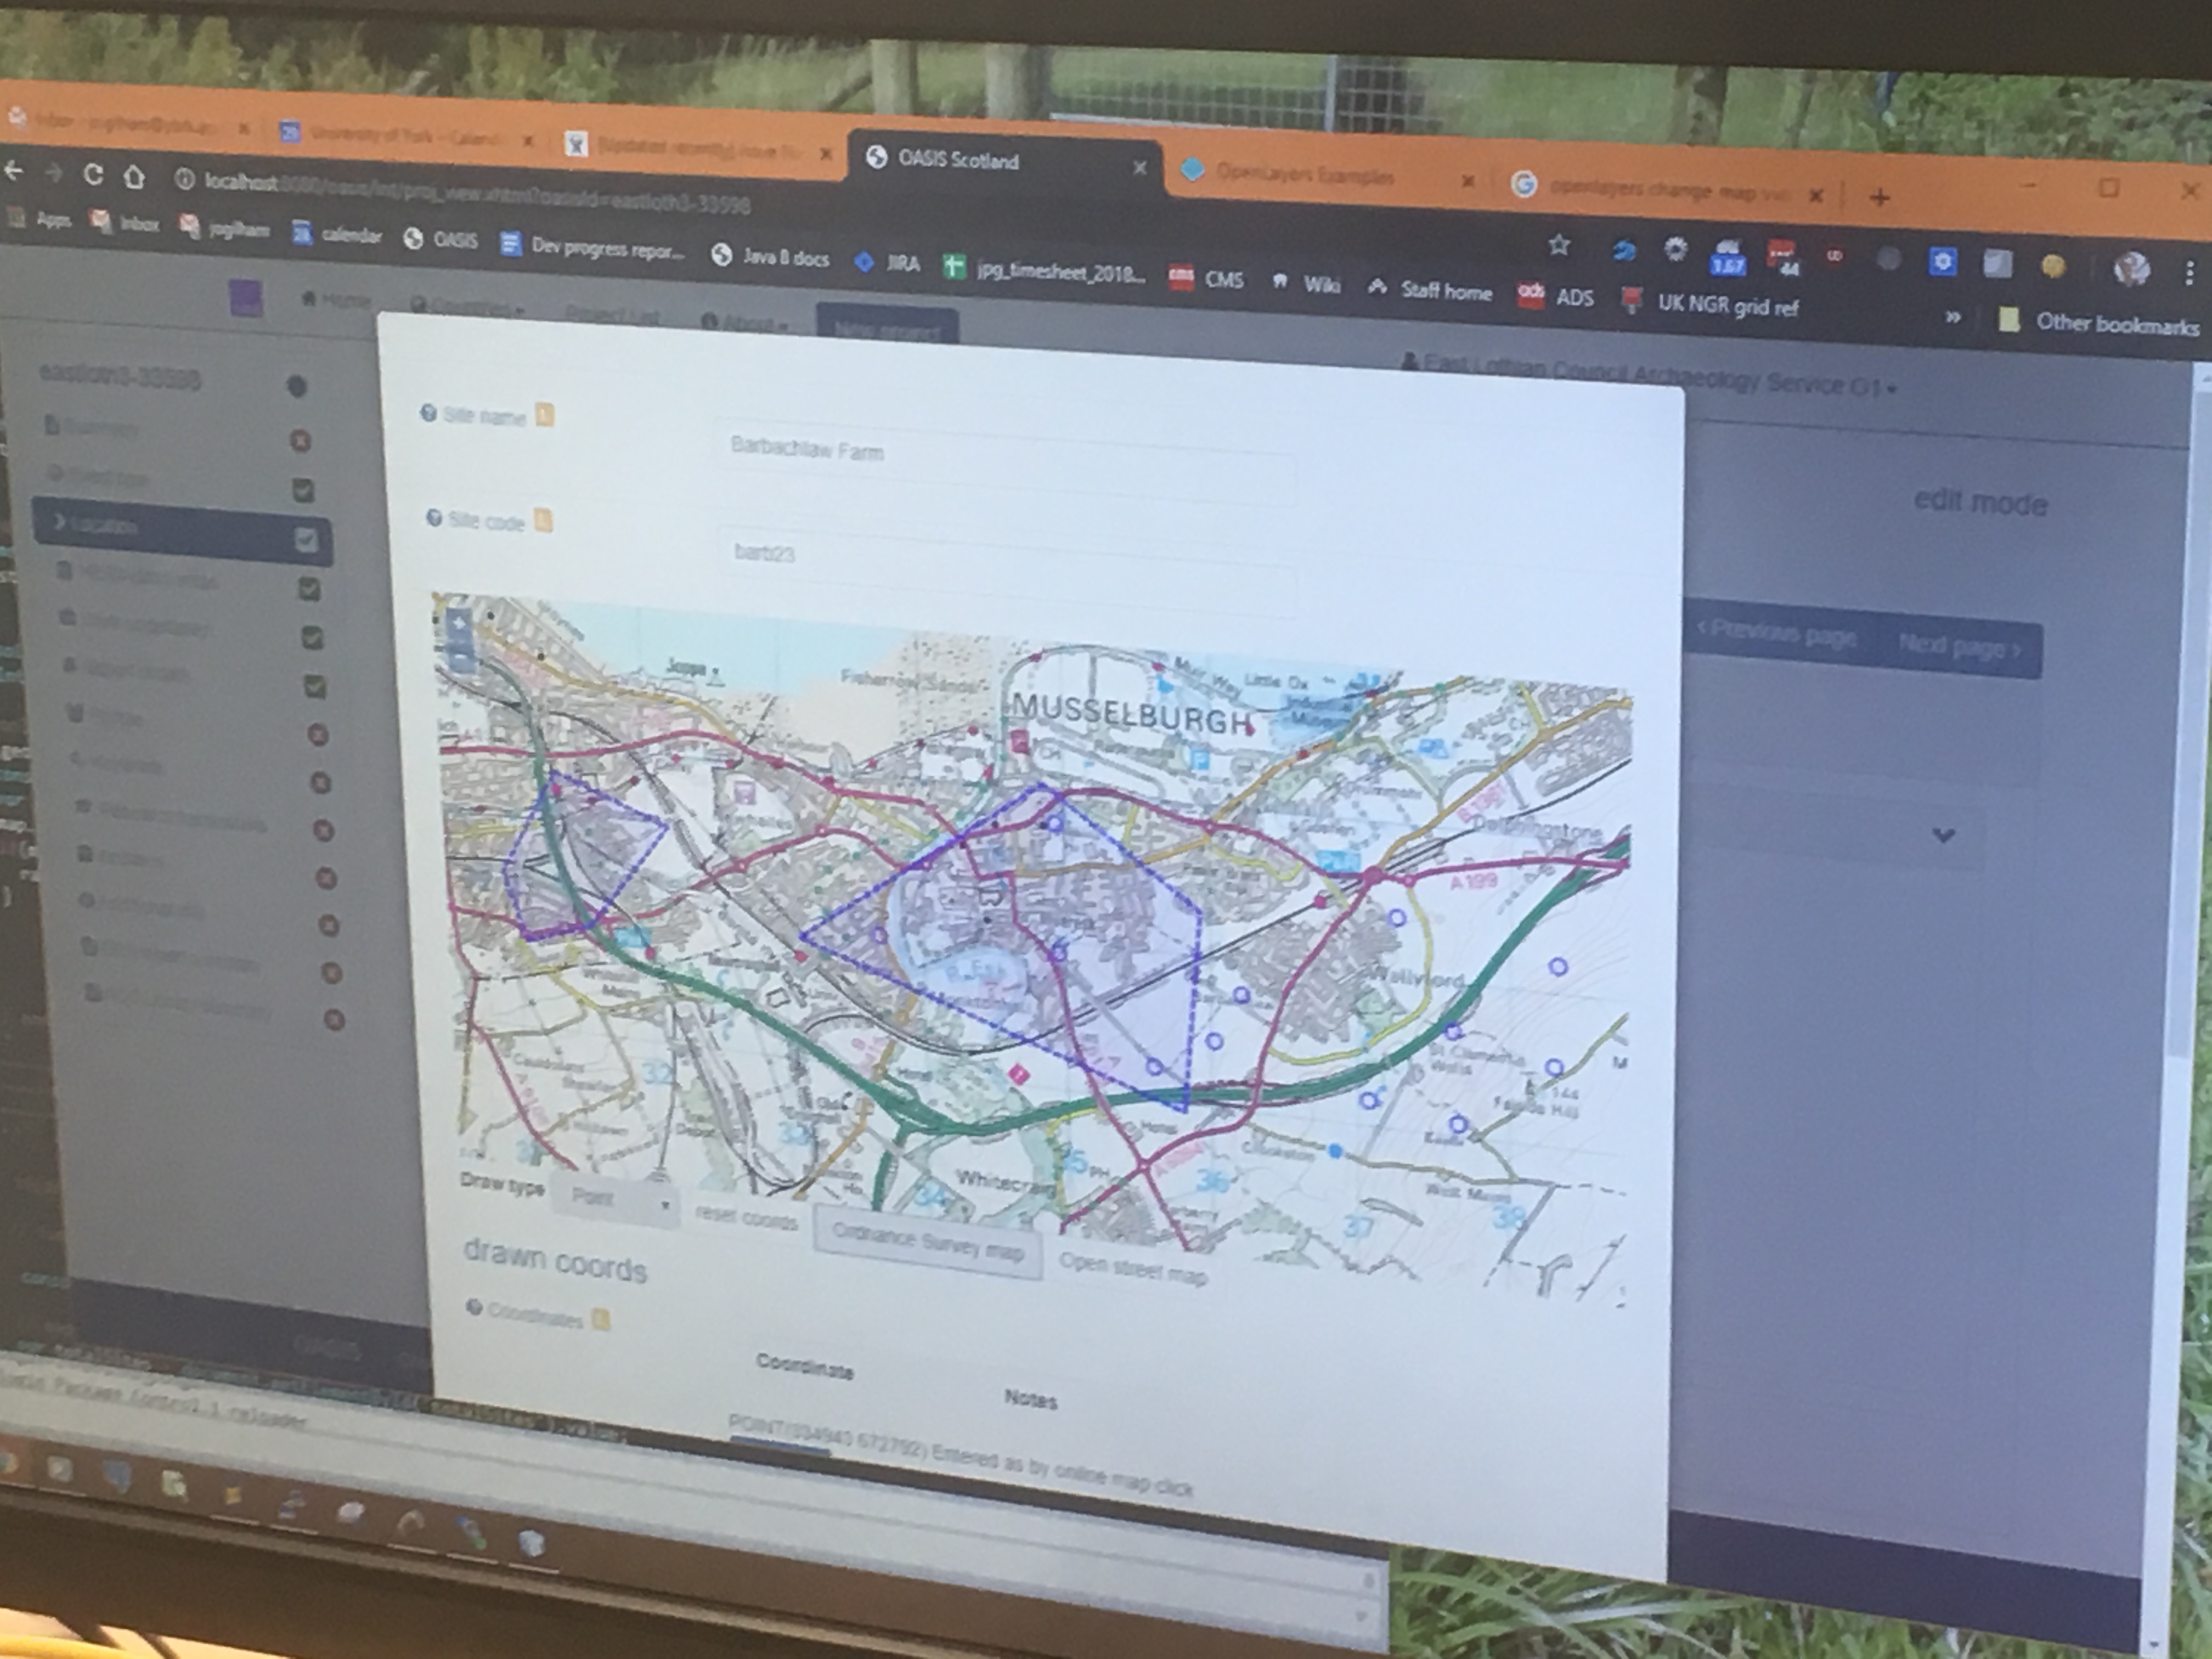
Jo has been hard at work knitting together the OpenLayers (v5) interface within a Java framework, and getting it to connect with the back-end (the classic QGIS – PostGIS stack). Without wanting to jinx things, the results are looking really good. A user can record multiple ‘sites’ within a single record, and each site can be represented by points and/or polygons. A user can also upload their own boundary files straight into the map! Once saved, a spatial query is run against an array of background mapping to generate admin areas, HER areas and (currently at review) collecting areas for Museums and Archives. Basically this tells a user where they are, and who the curators are for the record. It also allows a curator to log on and see records for ‘their’ area.
A little task we’re running in the background is coming up with ways to deal with legacy data migrated from the current database. One facet of this has been Polygons. The current OASIS database (Oracle) is not a true spatial database, and thus ‘geometries’ are stored as a set of points, but not a real polygon (if that makes sense). In order to have these polygons appear in new OASIS (PostGIS) as polygons, and not just a series of points we’ve had to do a bit of cleaning post-migration. Fortunately, we’ve been luck enough to have a fantastic Masters student (Kirsty Ackland) with us over the last few weeks. Kirsty has put my rather rusty GIS skills to shame…. In her own words:
“As part of setting up the map interface for the OASIS system an existing dataset was used to test the visualisation process. The original dataset (Oracle) is now held in a PostGreSQL/PostGIS database which was imported into QGIS. However the structure of the original data from Oracle meant the data could not be visualised as a geometry. To fix this, the dataset was run through QGIS’ database manager with a simple SQL query to retrieve only the data which was stored as polygons and output it in tabulated form to remove the geometry links. This was exported into Microsoft Excel to clean the data and remove unnecessary fields. This was then imported back into QGIS as a .csv file.
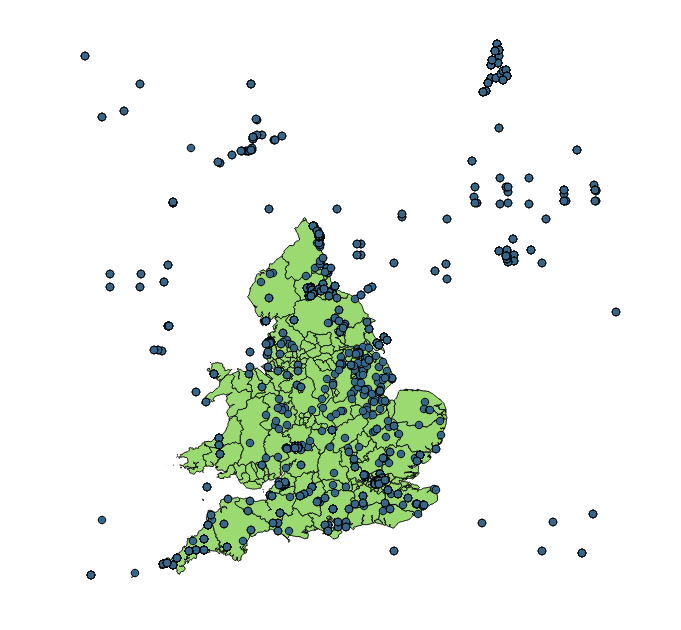
Because the geometry had been removed the records no longer had spatial references associated with them, so the next step was to find the original input co-ordinates for each record in the OASIS database. This was done using an SQL query to join of several tables within the OASIS database using the OASIS_ID, SITE_ID and GRIDREF_ID assigned to each project during data entry. This produced a table holding all of the IDs necessary to re-associate the co-ordinates (also held within this table) for each site with their assigned OASIS ID using a one-many relational join (one oasis/project ID to many gridref/co-ordinate IDs). The first dataset was then joined with the ID table using the OASIS_ID to add in the easting and northing points to their relevant project information. This was then quickly queried to remove any duplicate fields created by the process and was output into QGIS with its corrected geometry (fig 1).
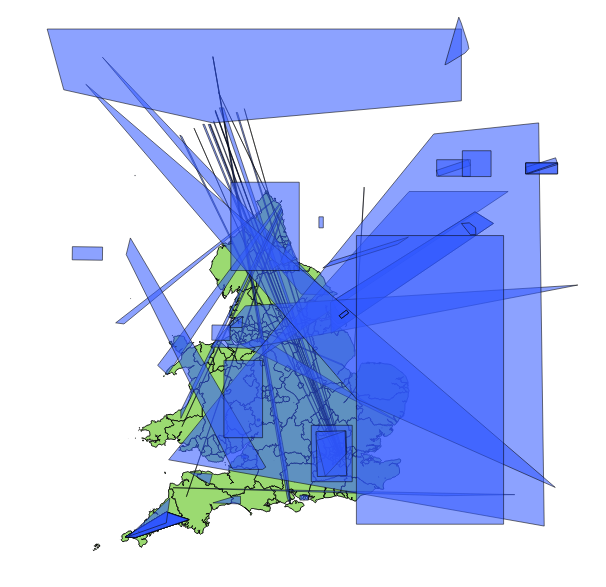
To create bounding boxes for the sites held within OASIS for visualisation on the map, the convex hull tool within QGIS was used to join the co-ordinate points together a create separate polygons based on their siteID (fig 2). However, when this was complete it soon became apparent that some of the co-ordinate points were entered incorrectly resulting in the weird output seen in the screenshot where there are sharp lines running north-south. The screenshot also shows that some are in the correct place though, which suggests that this workflow works well as long as the data is correct. A secondary point to note is that some of the sites only relate to one co-ordinate point, but have been stored as “polygons” during data entry. This means although they exist within the dataset as point data, when converted to polygon to show their extent they get removed because shapefiles
can only store one datatype at a time i.e. point or polygon. The effects of this can be seen in fig 3.
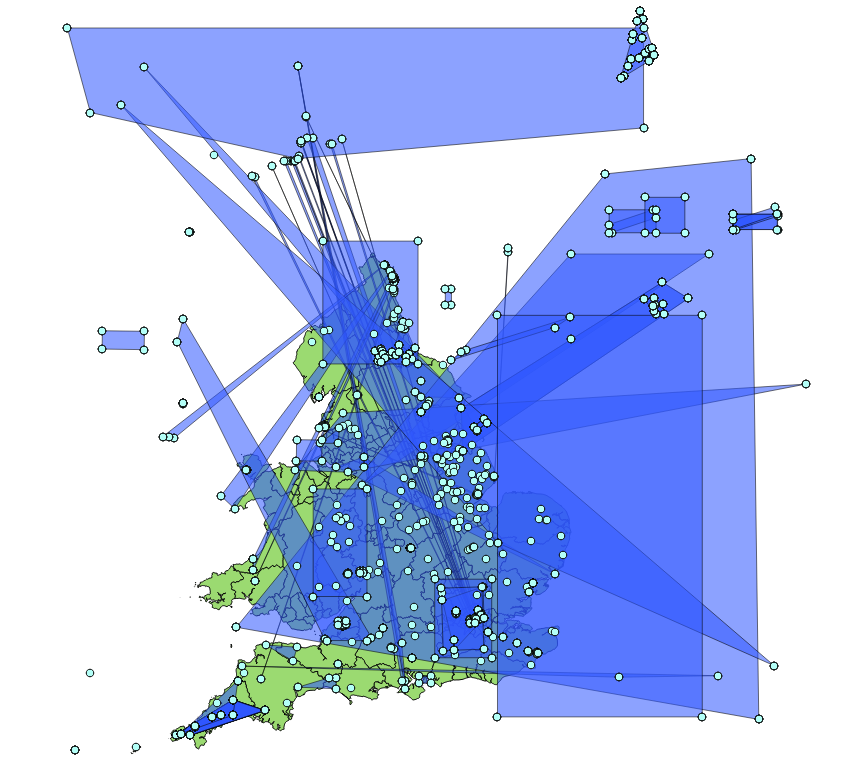
This is also an issue to bear in mind when considering the point data removed from the dataset right at the start of the process, as it is very likely some of the sites should be stored as polygons rather than points, leaving the visualised data output here incomplete.”
It’s at that point that I think we’re going to stop. We now have real functioning polygons in our new database. Some of them may be incorrect, but this is just the legacy of manual data entry (with no immediate visual control) in the current OASIS form, and which does date back to 2004. Hopefully the new system will deal with this alot more efficiently! Thanks to Kirsty for her quick and efficient help on this.