Case study 1: Deansway
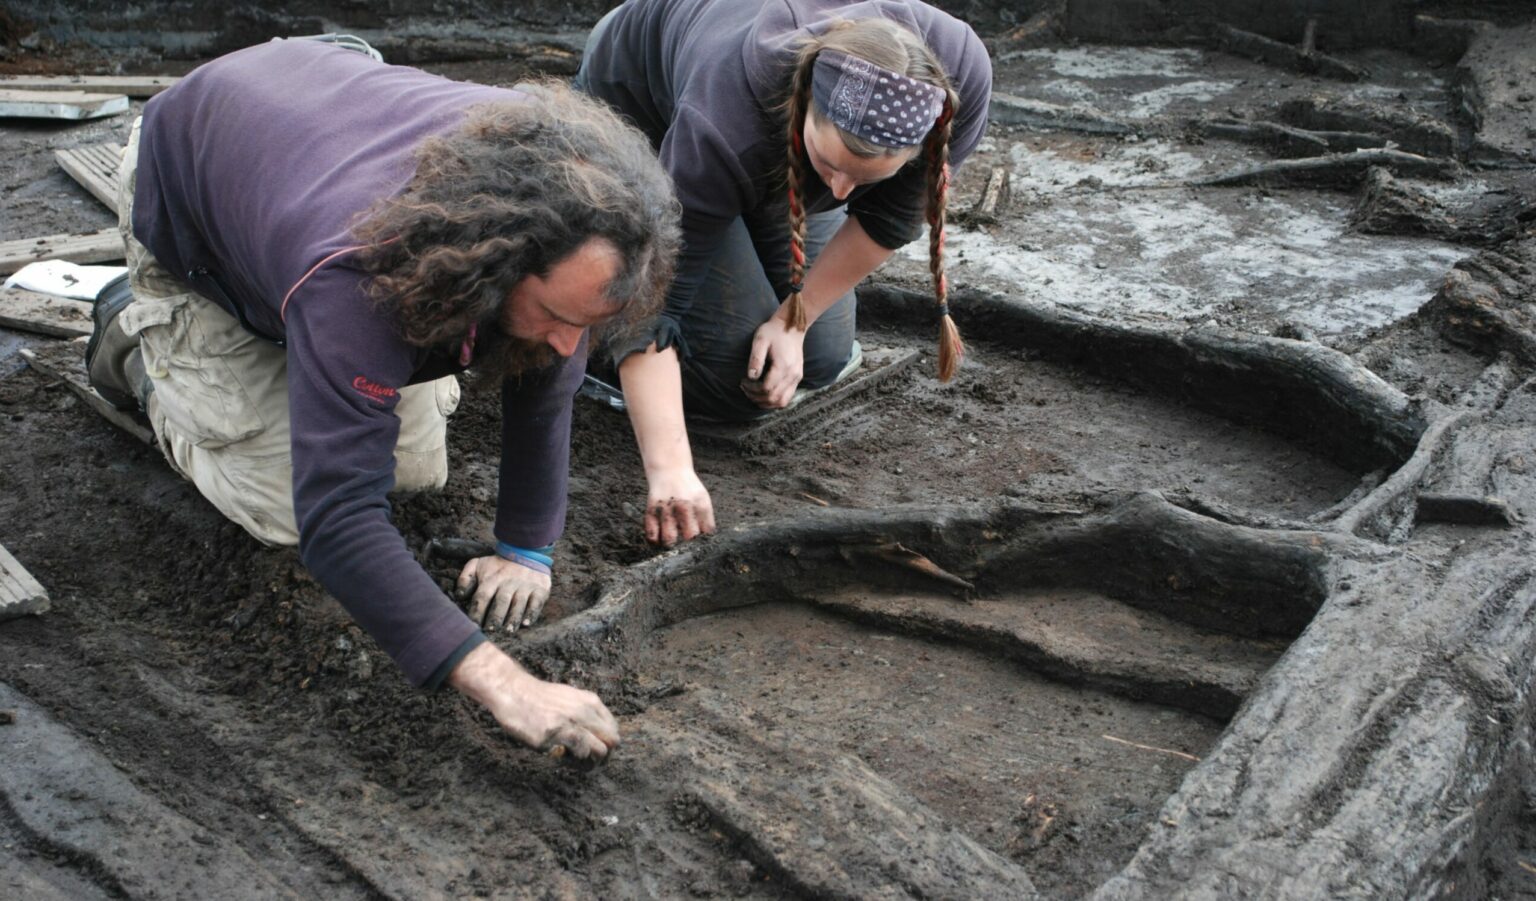
Major excavations on four sites in the centre of the city of Worcester were undertaken between 1988-1990 and revealed an extensive series of deep, well-preserved archaeological deposits which included evidence of Roman industrial activity and burial, an early medieval ‘dark earth’ deposit, a complex of medieval and post-medieval rubbish and latrine pits associated with tenement buildings fronting the main road, and the remains of a 15th century bronze foundry with bell pit. From the beginning, the importance of an efficient and flexible computer system was recognised. Particular emphasis was placed on the post-excavation process, although it rapidly became apparent that the computers had a much wider impact in terms of general illustration, display and education work, finds processing, site planning, staff development and public relations (Huggett 1989; Templeton 1990).
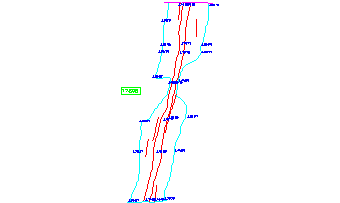
As is common practice in the UK, a single context planning system was used on site. Each context, representing any single event or action, was given a unique identifying number and individually planned, photographed, excavated and recorded. At Deansway each individual context plan was digitised into its own drawing file which was given the context number as its file name.
Planning conventions were used to ensure all context plans were drawn in a similar way. A series of line conventions were used to signify top and bottom edges of features, cut edges, temporary edges, and indefinite edges, for example. Similarly, standard formats for the inclusion of context numbers, level points and grid points were used.
A small number of basic layers were used to structure each drawing:
- ‘Levels’ used for level point symbols and associated values
- ‘Contexts’ used for context symbols and associated numbers
- ‘Notes’ used to annotate plans
- ‘0’ default AutoCAD base layer, onto which all other drawn elements were placed.
These layers separated drawn elements from annotations and other textual elements, allowing plans to be merged without major conflicts. The use of layer 0 for drawn elements might cause problems because it is the default layer and it is easy to add to or edit this layer inadvertently. For this reason it might have been better if the drawn elements had been placed in a named layer in the Deansway model. Some additional layers would also have been useful so that top and bottom edges of cuts, for example, could have been differentiated.
Given the thousands of context drawings involved, it was vital to ensure that a completely consistent approach to digitising was adopted. A base prototype drawing was set up which acted as a template for creating context plans. This contained the necessary layers and line types, and also referenced a set of program functions and modified menus which were created with the aim of simplifying the creation of a digitised context drawing. Aids were developed to make it easy for draughtspeople to make the drawings and to maintain consistent styles. For example, menu options allowed the easy conversion of digitised lines to the type and colour prescribed in the convention and facilitated the insertion of pre-defined drawing elements, such as North arrows and formatted drawing title, scale, and location information. Other options, called small AutoLISP programs, were used to automate more complex functions – for instance generating level points with their values and placing grid point symbols with coordinate values (Huggett 1990).
This configurability was one of the reasons AutoCAD was used in the first place, and the value of this decision is shown in the way that the same menus and functions have been migrated through several sunsequent versions of AutoCAD without modification. The customised interface and associated functions also greatly simplified the training of new users, and enabled consistency of plans not only within a single site but amongst several sites.

Once the digitisation of a context was completed, a function was provided to ensure each plan was saved in the same state. A record was automatically written to a data file which included the context number and coordinates relating to the extents of the context.
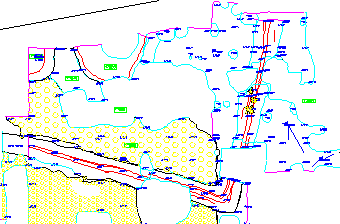
Since the internal coordinates of AutoCAD were mapped onto the Deansway site grid, different contexts can be brought together with ease and automatically positioned correctly both relative to the grid and each other, either as blocks (copies of contexts) inserted into an overall plan, or as cross reference files, i.e. links to the original file enabling changes to individual context plans to be reflected in the area plans. A number of tools were created to simplify this process; for example one AutoLISP routine took lists of contexts from Microsoft Excel and allowed them to be plotted automatically.

The primary emphasis at Deansway was the investigative value of this process. Context plans were combined to create Context Groups, Context Groups could be combined to create Activity Units and Activity Units combined to create Phases, all based on the same context-level drawing files. The composite structure and phase plans generated were used as draft plans which were originally inked by hand for publication, though improvements in technology make this unnecessary today. The overall methodology established by the Deansway Project has proved extremely robust over the years and remains in use. Modifications to the original methodology for subsequent projects include the definition of additional drawing layers in order to structure plans in a more flexible manner, and a greater emphasis on the use of polylines rather than freehand sketched lines. This simplifies subsequent modification within AutoCAD and also aids re-use in external packages such as GIS.


