Scan data deliverables
Once a point cloud dataset has been co-registered then it can be used to generate any number of different products. Point cloud datasets are typically only viewable in the software used to process them so an emphasis is placed on creating or extracting products from the point cloud that are useful in other applications. For smaller artifacts or objects, the most typical product is a polygonal mesh (English Heritage 2007, 12). A polygonal mesh is created by connecting neighboring points to create a surface representation of an object. The process of creating and refining a mesh is very complex and is detailed more in the meshing section below. For larger structures and entire sites, the processing workflow is a bit more varied (English Heritage 2007, 13). Different deliverables can include a polygonal mesh, 2D CAD drawings (plans, elevations, and sections), 3D CAD drawings (complete surface models), digital elevation models (DEMs), cross sections, or an animation/flythrough of the dataset. Either the registered point cloud or a meshed product can be used to generate the different deliverables listed above.
Create and edit polygonal mesh
Preparing the point cloud for meshing
- During pre-mesh editing, it is advised to record the premeshing metadata detailed in Metadata for additional products.
The process of creating a complete polygonal mesh for an object involves numerous steps including data cleaning, resampling, meshing/triangulation, hole filling, and mesh optimization (3D Risk Mapping 2009, 57). To prepare the registered point cloud for meshing, the point cloud will often have to be cleaned to remove extraneous data points and overlapping or redundant data. Overlap reduction is available in most processing software as an automatic operation that computes the best data for an area based on either distance to the scanner (the points that are closer are given priority) or viewing angle (points more orthogonal to the scanner are given priority). Some software also provide the option to average all overlapping scans. Overlap reduction is used to remove redundant data and to also decrease the size of the point cloud to optimize it for meshing. In addition to overlap reduction, users may wish to smooth or subsample the dataset. Subsampling also reduces the size of the point cloud and smoothing the point cloud can filter out noise caused by the scanner though smoothing can also remove fine details and should be used cautiously.
If RGB data is a priority, then the color between the scans will need to be adjusted in the pre-meshing stage. Color editing tools including brightness, contrast, and hue adjustment are available in some processing software. An effort should be made to balance these three parameters across a series of scans so that no artifacts or ‘seams’ can be observed in the RGB data for the entire object.
In addition to the edits described above, the user will also often manually delete erroneous data that was not automatically removed by one of the processes described above. These manual deletions can include random or irrelevant data points, remnant data from the overlap reduction process, or data that is of poor color quality. All operations including overlap reduction, subsampling, smoothing, RGB editing, and manual edits should be summarized in the metadata section.
Creating and editing a polygonal mesh
- During mesh creation and editing, it is advised to record the meshing metadata detailed in Disseminating laser scan data.
Meshing is the process of connecting points to create a surface representation of an object and typically involves combining multiple scans over a given object or area. Different algorithms exist to create meshes from point clouds, one of the most common is Delaunay Triangulation (3D Risk Mapping 2009, 57). While it is not essential to know the exact meshing technique used in a software, it is good to have a basic understanding of the input parameters that can affect the result of a meshing operation. These parameters can include a distance criterion used to connect points, optional smoothing, subsampling, and optimization techniques. The most important of these is the distance criterion used to connect points. If set to large, then points can erroneously be connected giving the data a ‘stretched’ appearance while if set to small, then not enough points are connected causing the data to look to ‘sparse’. A good rule of thumb is for the distance value to roughly be 10 times the interpolation step (resolution of the data set). Additional parameters to adjust can include smoothing and subsampling. A low level smoothing filter can help reduce scanner noise in the data however if minute details are important in the final mesh product it is generally advised to not smooth the data during the meshing process. It is generally advised to reserve all smoothing, subsampling, and mesh optimization operations for post mesh processing where the results can be directly observed.
Mesh editing can be a very complex process. Mesh editing can include a number of operations including hole filling, smoothing, despiking, color editing and/or texture mapping and others. The purpose of mesh editing is to create a final mesh product that best represents the original scanned object. The primary operation is hole filling where holes or voids in the dataset are ‘filled in’ using either flat or curvature based filling algorithms. Scanning from multiple positions and angles should minimize holes in the data however complex object shapes can be a challenge. Hole filling is often available in processing software as both automated and manual processes.
Despiking is generally recommended for removing spikes in the data caused by extraneous data points and is also typically an automated process. Smoothing is also very important for removing scanner noise and other artifacts that can occur as part of scan acquisition and data processing. Smoothing is typically an automated process where the user can specify the strength of the smoothing filter and additional manual or interactive smoothing is often available for smoothing a specific area of an object. Additional mesh optimization operations can include retriangulate/remesh operations where the mesh is literally remeshed to remove imperfections that have occurred as part of the mesh editing process. Additional optimization can include decimation where the number of triangles in a mesh are reduced to optimize data handle-ability or to create lower resolution deliverables.
Finally RGB editing and or texture mapping is an important part of the mesh editing process in projects where a creating a ‘photo realistic’ model is important. For models where RGB data has been collected as part of the point cloud, the colors of the individual scans should ideally be adjusted to match one another in the premeshing stage. Once a mesh has been created from individual scans then the overall color of the meshed model can be adjusted for the whole object. Alternately, users may wish to apply color data by mapping a series of photos onto the meshed product. The process of texture mapping in a given software typically allows the user to identify common points or identifiable features between the 3D dataset and the image. For the most accurate color, texture mapping also requires for individual photos to be color balanced to one another to ensure consistent color across the entire 3D project.
Create 2D CAD models (Cross sections, plans and elevations)
- During 2D CAD Creation, it is advised to record the metadata detailed in Disseminating laser scan data.
2D CAD drawings including cross sections, plans, and elevations can be created from the original registered point cloud or a meshed product. While numerous algorithms are available to automatically identify and extract features of interest from a 3d dataset, all automatic feature extraction requires some amount of manual editing and human interpretation (3D Risk Mapping 2009, 56). Cross sections can automatically be generated or ‘fitted’ to an object often requiring the user to specify the axis direction, number of desired sections, and fit tolerance. Automatically fitting cross sections is most successful when applied to small meshed objects that are completely enclosed otherwise additional editing is often required. A manual method for creating sections involves slicing a dataset along a specific direction using clipping planes to isolate a section of points and then manually tracing the perimeter of the points.
Creating plans and elevations is a similar process that involves the extraction and/or manual tracing of features of interest directly on the point cloud or mesh and then projecting those line tracings onto a plane to create the final plan or elevation product. The process of manual feature tracing can be a difficult, time consuming task that requires a lot of skill (3D Risk Mapping 2009, 56). During the process, the user will make assumptions and decisions about how to handle data voids, how to reconstruct sharp edges, whether or not to constrain geometries to 90°, and more. The user’s skill set and understanding of the data and the scanned object influences the decisions that are made and therefore directly affects the results of the end product. Here, we reiterate again to compare the derived product to the original dataset and/or provide fit statistics in order to be able to assess the validity of a final product.
Create 3D CAD model
- During 3D CAD Creation, it is advised to record the metadata detailed in Metadata for Additional Products.
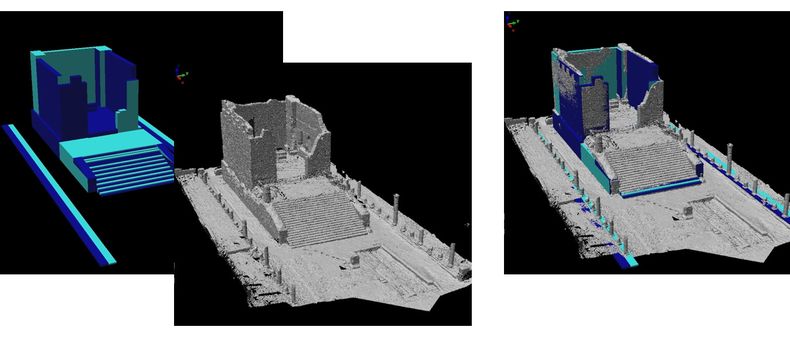
A 3D CAD model is a collection of 3D primitives that are fitted to a point cloud. 3D CAD models do not typically include all of the subtle details of the original dataset but instead are understood as models or representations of the data. Standard 3D primitives can include planes, cylinders, cubes, and spheres and can also include more complex 3D shapes that have been extracted from 2D lines or curves. Fitting standard 3D primitives typically involves selecting a portion of the data that is a generic 3D shape and then invoking a command that ‘fits’ the predefined shape to the selected area. Numerous statistics that show the size, volume, and fitting error of the shape inform the user how well the shape actually approximates the selected area. Additionally 2D profiles of 3 dimensional shapes can be traced on a dataset using the methods described above in the 2D Modelling Section and then extruded to create 3D geometries. Methods used for creating 3D geometries from 2D lines/curves include extruding, lofting, and revolution around an axis. 3D CAD models, like meshes, can also have image texture maps.

Both 2D and 3D CAD modeling require a lot of skill and are often very time consuming. All 2D/3D CAD models should be checked against the original dataset to verify the quality of the final CAD product.
Create digital elevation model
- During DEM Creation, it is advised to record the metadata detailed in Metadata for Additional Products.
Digital elevation models (DEMs) are typically created from airborne laser scanning datasets but can also be created from terrestrial datasets as well. DEMs are a digital representation of a surface usually in a raster or image based format where each square or pixel has a height or elevation value. DEMs are best suited for terrestrial point cloud datasets that are 2.5D in nature. A 2.5D dataset can be fitted to a plane where for every X,Y position there is only one Z value. Converting point cloud data to a DEM can be very useful for employing GIS raster analyses to accentuate or extract features from a dataset. For example, one could use curvature or slope based analyses to accentuate engravings on a flat stone surface. Spatial filtering to determine data patterns and trends is another useful tool in GIS software. DEMs can be created from exporting a point cloud dataset to a GIS package and then generating either a TIN (Triangulated Irregular Network) surface or a DEM raster. The resolution of the DEM is a key consideration because a DEM employs uniform point spacing and most terrestrial datasets, unless acquired exactly perpendicular to a surface, are not. So, if the resolution is too course, important details may be lost or if it is too fine than details will be retained from some areas and data artificially generated in others. For more information on DEMs, please refer to the DEM section in the GIS Guide.
Create video/animation of dataset
- During video creation, it is advised to record the metadata detailed in Metadata for Additional Products
Videos or animations are often the most effective manner in which to illustrate the true 3D quality of a dataset in a 2D medium. Most software offer simple animation wizards that allow the user to record simple object rotations or to fly around in a 3D scene. Videos can typically be recorded for most data types including point clouds, meshes, and 2D/3D CAD models. Technical considerations for creating videos include video resolution, codec selection and compression, file size, and dissemination. For more information see the separate Digital Video guide.


